May- Multiple Magnetometer Sensor Arrays and their Applications in Marine Environmental Surveys
By: Mikhail Tchernychev, Ross Johnson, and Jeff Johnston, Geometrics, Inc.
Introduction
A magnetometer is a device used to measure the magnetic field at a point in space. All magnetometers can be divided into two groups — vector magnetometers measure the magnetic field in terms of its components (fluxgate and SQUIDs are examples) while total field magnetometers such as Proton Precession, Overhauser and Optically Pumped Quantum magnetometers measure the scalar (directionless) value of the field. The total field magnetometers measure the amplitude of the magnetic field regardless of the magnetometer orientation. All magnetometers are passive devices that do not rely on energizing the nearby environment.
Manmade objects made of steel or iron alloys such as a ship’s hull, munitions and pipelines can distort the Earth’s field and are therefore detectable by sensitive magnetometers.
Marine Portable Magnetometers
Marine magnetometers are produced commercially by two companies, Marine Magnetics of Markham, Ontario, Canada and Geometrics of San Jose, Califonia, USA. The Marine Magnetics technology is based on a proton precession variant known as Overhauser, which has low power requirements, good absolute accuracy and a sample speed of 1 to 5 Hz. Geometrics produces an optically pumped Cesium Vapor magnetometer that has high sensitivity and high sample speed of 10 to 20 Hz. Marine magnetometers have digital RS-232 data output and provide other measurements such as depth and height above the seafloor.
Locating Unexploded Ordinance (UXO) and chemical munitions
Magnetometers are routinely used for UXO clearance surveying because explosive projectiles include a steel shell. One of the highest concentrations of UXO is in the coastal waters off the southern UK and Northwestern Europe. Here, WWII bombardment and post-conflict dumping of munitions left large areas of the seabed littered with hazardous material. The munitions include conventional explosives as well as chemical warfare agents.
Today wind turbine farms are being constructed in some of the coastal regions where UXO is encountered. Surveying prospective construction areas of the seabed is helpful in identifying dump locations and also the positions of isolated objects that could pose a risk. Magnetometer arrays have been an important part of these surveys in the last few years. Due to the sheer volume of dumped munitions and the size of the areas where wind farm development is planned, the effort has required the deployment of many dozens of highspeed magnetometer arrays and extensive survey efforts.
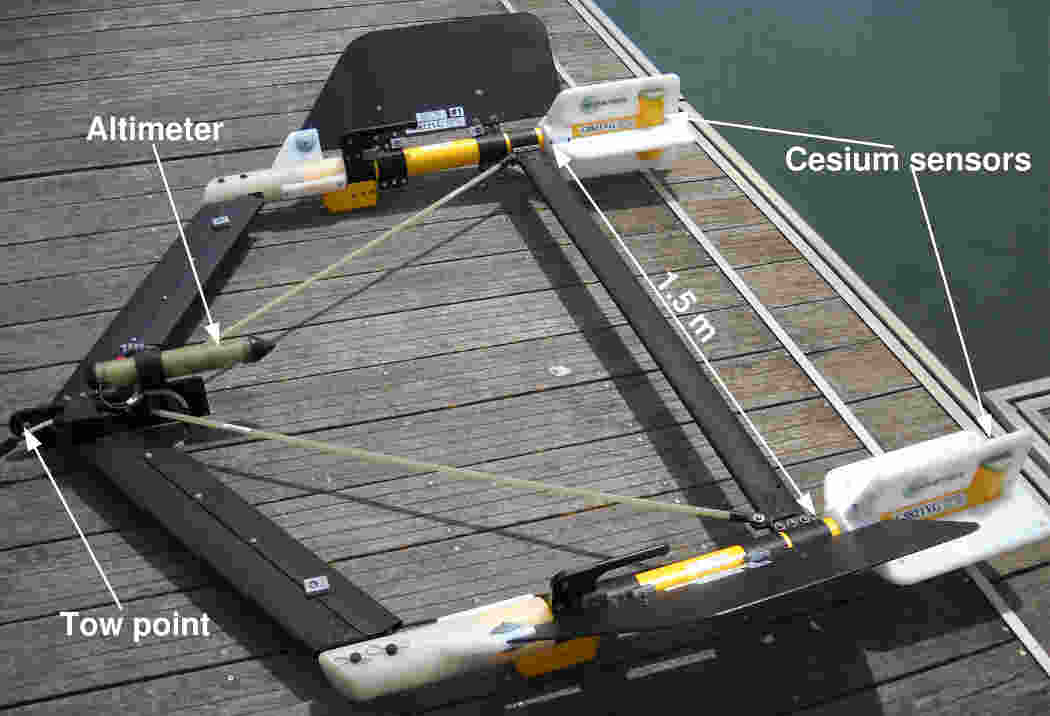
Figure 1. Two Geometrics 882 sensors in Transverse Gradiometer (TVG) configuration.
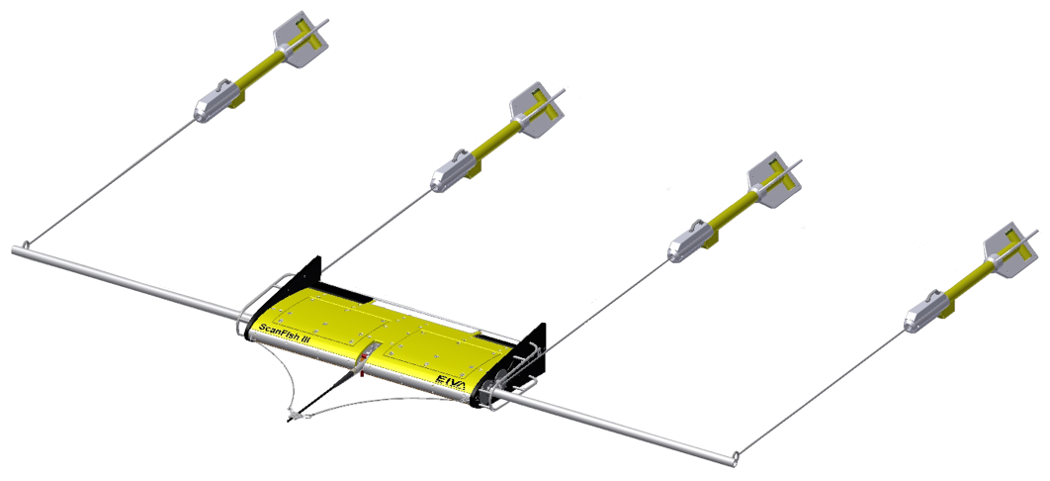
Figure 2. Four sensor SCANFISH system used for UXO locating in the North Sea (Photo courtesy of EIVA, Denmark).
To assist the interpreter, Geometrics Inc. has developed Open-Source software to carry out processing tasks. The software is designed for data collected using transverse arrays of magnetometers that are commonly referred to as Transverse Gradiometers (TVG) or more sophisticated multisensor arrays (Figures 1 and 2). The interpretational stages include the following:
1. Total Field data pre-processing, including diurnal correction for Earth’s field variations over time.
2. Creating Total Field Maps if there is sufficient data density.
3. Creating Analytic Signal maps [1,2]. The Analytic Signal maps greatly reduce the anomalies’ visual complexity, yielding simple positive anomalies instead of a complex “dipole” signatures and reduce the effects of geology (Figure 3). Geometrics TVG system uses two sensors to generate the analytic signal computing the vertical gradient using mathematical techniques.
4. For each individual profile anomaly a numerical inversion can be carried out using an inversion toolkit [3] to estimate depth, position and magnetic moment of the object, which are an indirect indications of the target’s mass. 5. The results can be presented as worksheets and color “plates” (Figure 4), with magnetic field map, graphs and target parameter information in text format.
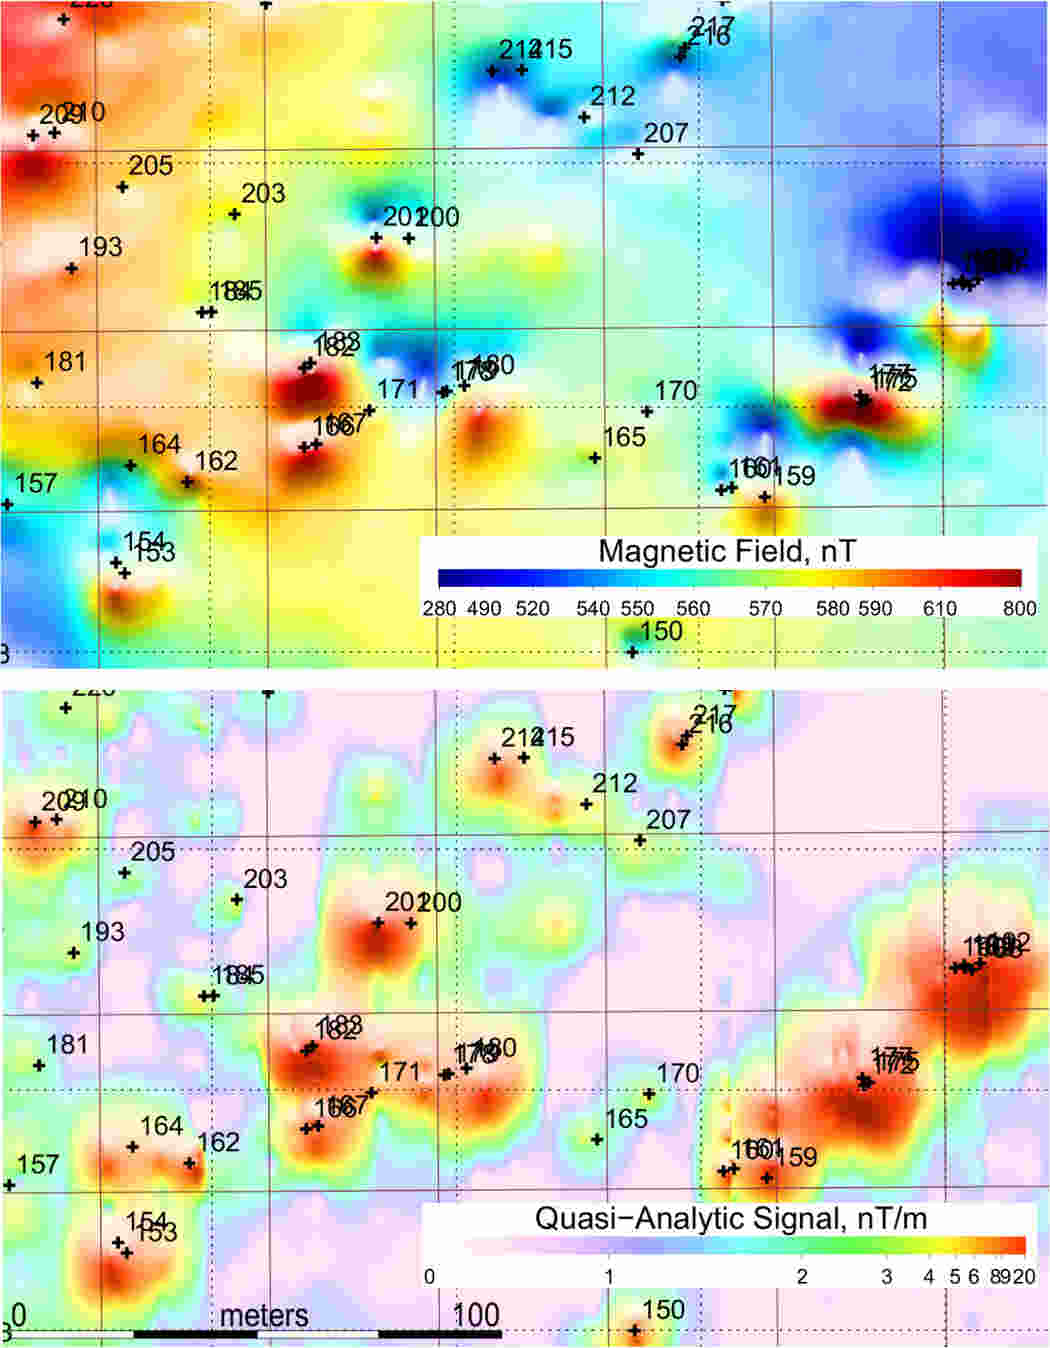
Figure 3. Total Magnetic field Map (top) and Quasi Analytic signal (bottom). It can be seen that Quasi Analytic signal map is a simplified version of total field map [4].
Pipeline locating Buried steel pipelines are another type of structure that may be located by magnetometer surveys, although interpretation of the data can be challenging. Although a pipeline is a simple, uniform object for much of its length, its magnetic field is complex with minimums and maximums interleaved in a seemingly random order. This effect is due to differences in the magnetization along the pipe as well as to the presence of flanges or other structures at the pipeline’s joints. The analytic signal analysis reduces these anomalies to simple, positive bell-shaped features. The depth of the pipeline can be estimated by applying simple half-width rules to the analytic signal. Typical field over the pipeline is shown on Figure 5.
High Voltage Direct Current (HVDC) cable application
High Voltage Direct Current (HVDC) technology is now widely used to transmit electrical power over considerable distances using submarine cables. These cables are inspected periodically and their location and burial depth verified.
In 2009 and 2013, Alpine Ocean Seismic Survey, Inc. conducted an inspection of the “Neptune” HVDC cable off coast of New Jersey using two Geometrics G-882 magnetometers in TVG mode. The surveys provided cable position and depth estimates, along with probable cable orientation. To achieve these goals Geometrics has developed modeling software using a simple current pair model [6].
The magnetic field created by a HVDC cable is due the electrical current and not the material properties as in the case of a pipeline. Therefore, the measured field profile is fairly uniform from one survey crossing to another, with two of the TVG sensors reporting almost identical values. One of the cross survey lines, along with results of interpretation, is shown on Figure 6.
The cable itself comprises two parallel conductors, deployed horizontally [7]. It appeared that deviation from horizontal layout could be visible in the magnetic field.
Conclusions
Marine magnetometer arrays are now being used in large numbers to improve seafloor mapping. The systems have several important environmental applications:
1. UXO. This is the most developed application, with well understood acquisition procedures and processing software. UXO targets are treated as objects that generate a simple magnetic dipole field.
2. Pipelines. Observed anomalies show significant total field variations along the structures. This feature can be reduced to a simpler anomaly signature using the Analytic Signal approach. Half-Width analysis is useful to estimate depth of burial.
3. HVDC cables. This modern type of power transmission has only been minimally investigated. The example survey shows that it should be easy to recognize the power cable by its uniform signature. The initial inversion efforts provide an encouraging result: they show a very good match between the numerically modeled and observed field and realistic burial depth estimates.
All three of the examples can be processed using Geometrics Inc. Open-Source MagPick software. As with any complex software, training is valuable for its effective use. Instructional videos are available from the Geometrics website.
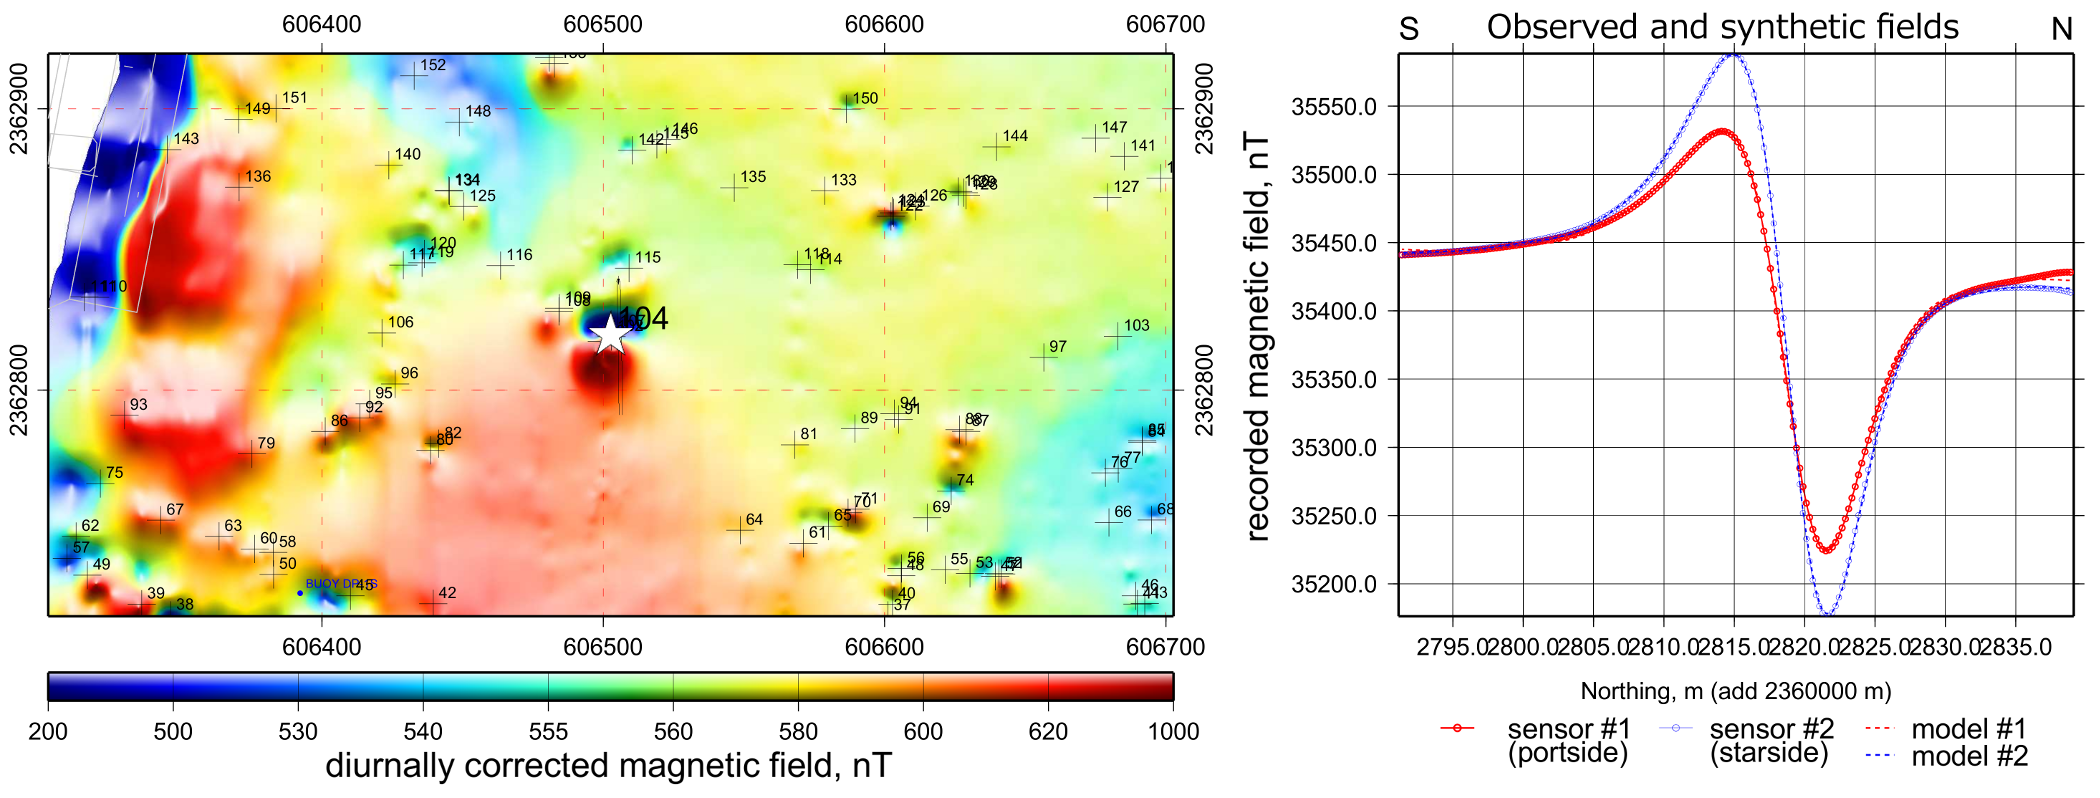
Figure 4. Top part of the automatically generated anomaly page (aka “color plate”) reported as part of UXO survey in Pearl-Harbor. White star shows location of the target under consideration over the part of the Total Field map. The part of the survey profile selected for interpretation is shown in the right, along with the magnetic field modeled as part of the inversion. It can be seen that observed and synthetic fields match almost exactly, which indicates good inversion quality. The plot is created with help of GMT [5].
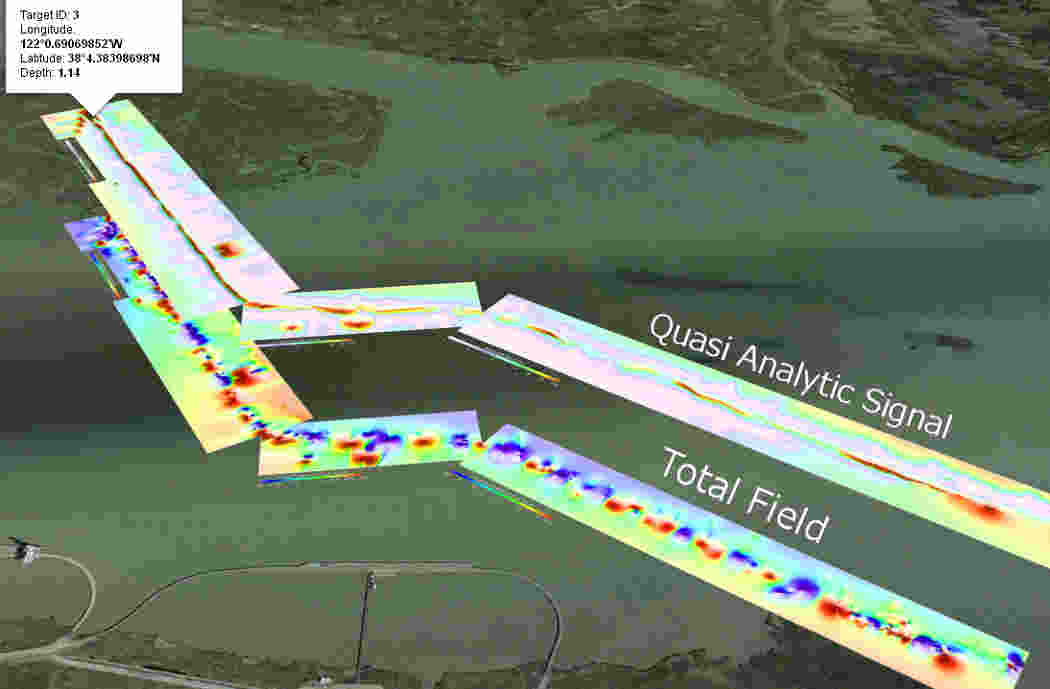
Figure 5. Total Magnetic Field (shown at sea level) and corresponding Analytic Signal (elevated) for gas pipeline near Ryer Island, California. One estimated pipeline location is shown as a balloon. It can be noted that while Total Field signature is very complex, Analytic Signal is greatly simplified.
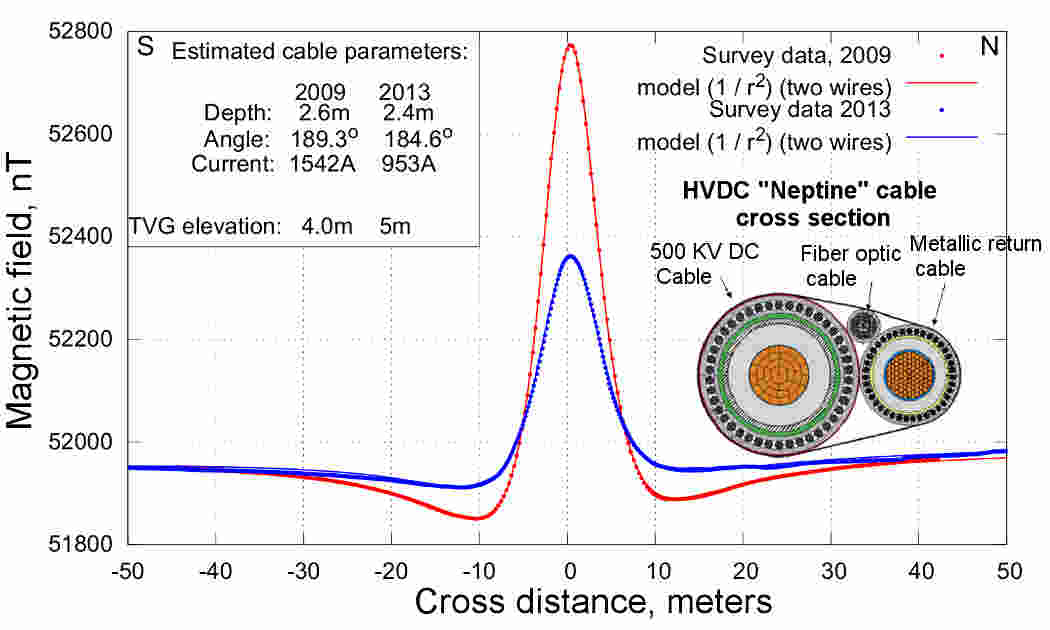
Figure 6. Inversion results for one of the HVDC cable intersections. The dots show actual measured data, the solid line represent synthetic field as result of inversion. The closer the data and model compare, the better the inversion quality. The insert on the right shows cable cross section.
Acknowledgements
We would like to thank Alpine Ocean Seismic Survey, Inc., New Jersey, for supplying data of HVDC survey over “Neptune” as well as Environmental Solutions, Inc., California, for sharing data over Ryer Island gas pipeline.
References
[1] Salem, A., D. Ravat, T.J. Gamey, and K. Ushijima. 2002. Analytic Signal approach and its applicability in environmental magnetic investigations. Journal of Applied Geophysics 49:231-244.
[2] Roest, W.R., J. Verhoef, and M. Pilkington. 1992. Magnetic interpretation using 3-D Analytic Signal. Geophysics 57:116-125.
[3] Tchernychev, M. and D. Snyder. 2007. Open source magnetic inversion programming framework and its practical applications. Journal of Applied Geophysics 61:184-193.
[4] Tchernychev, M., J. Johnston, and R. Johnson. 2008. Transverse Total Magnetic Field Gradiometer Marine Survey in Hawaii: The Quasi-Analytic Signal Approach and Multi- Channel Total Field dipole modeling. SAGEEP proceedings.
[5] Wessel, P., W.H.F. Smith, R. Scharroo, J. Luis, and F. Wobbe. 2013. Generic Mapping Tools: Improved Version Released, EOS Trans. AGU, 94(45), 409-410. Available from http://gmt.soest.hawaii.edu.
[6] Tchernychev, M., J. Johnston, R. Johnson, J. Tryggestad. 2013. Total Magnetic Field Signatures over a Submarine HVDC Cable. AGU proceedings.
[7] Stern, E., J. Nash, C. Schoeniger, C. Bartzsch, G. Acquaotta, M. Bacchini, and A. Orini A. 2008. The Neptune regional transmission system 500 kV HVDC project. 21, Rued’Artois, F-75008 PARIS. www.cigre.org