A Tool for Simplifying Oceanographic Data Interpretation
Ocean News
Oceanographic instruments measuring currents and other aspects of ocean behavior collect vast amounts of data. Processing and interpreting these data has traditionally been the preserve of highly specialized scientists working with their own custom-built programs.
Now the field is opening up to a wider range of users with the advent of unique software designed to simplify data interpretation.
The software, known as Ocean Contour, is the product of extensive consultations with members of the oceanographic community in an effort to meet their needs in a fast-changing technological environment. Expanding on-board data storage capacity and longer battery life mean instruments are capable of staying submerged for a longer period of time – and that means they re-surface with many gigabytes more data than was the case even a couple of years ago.
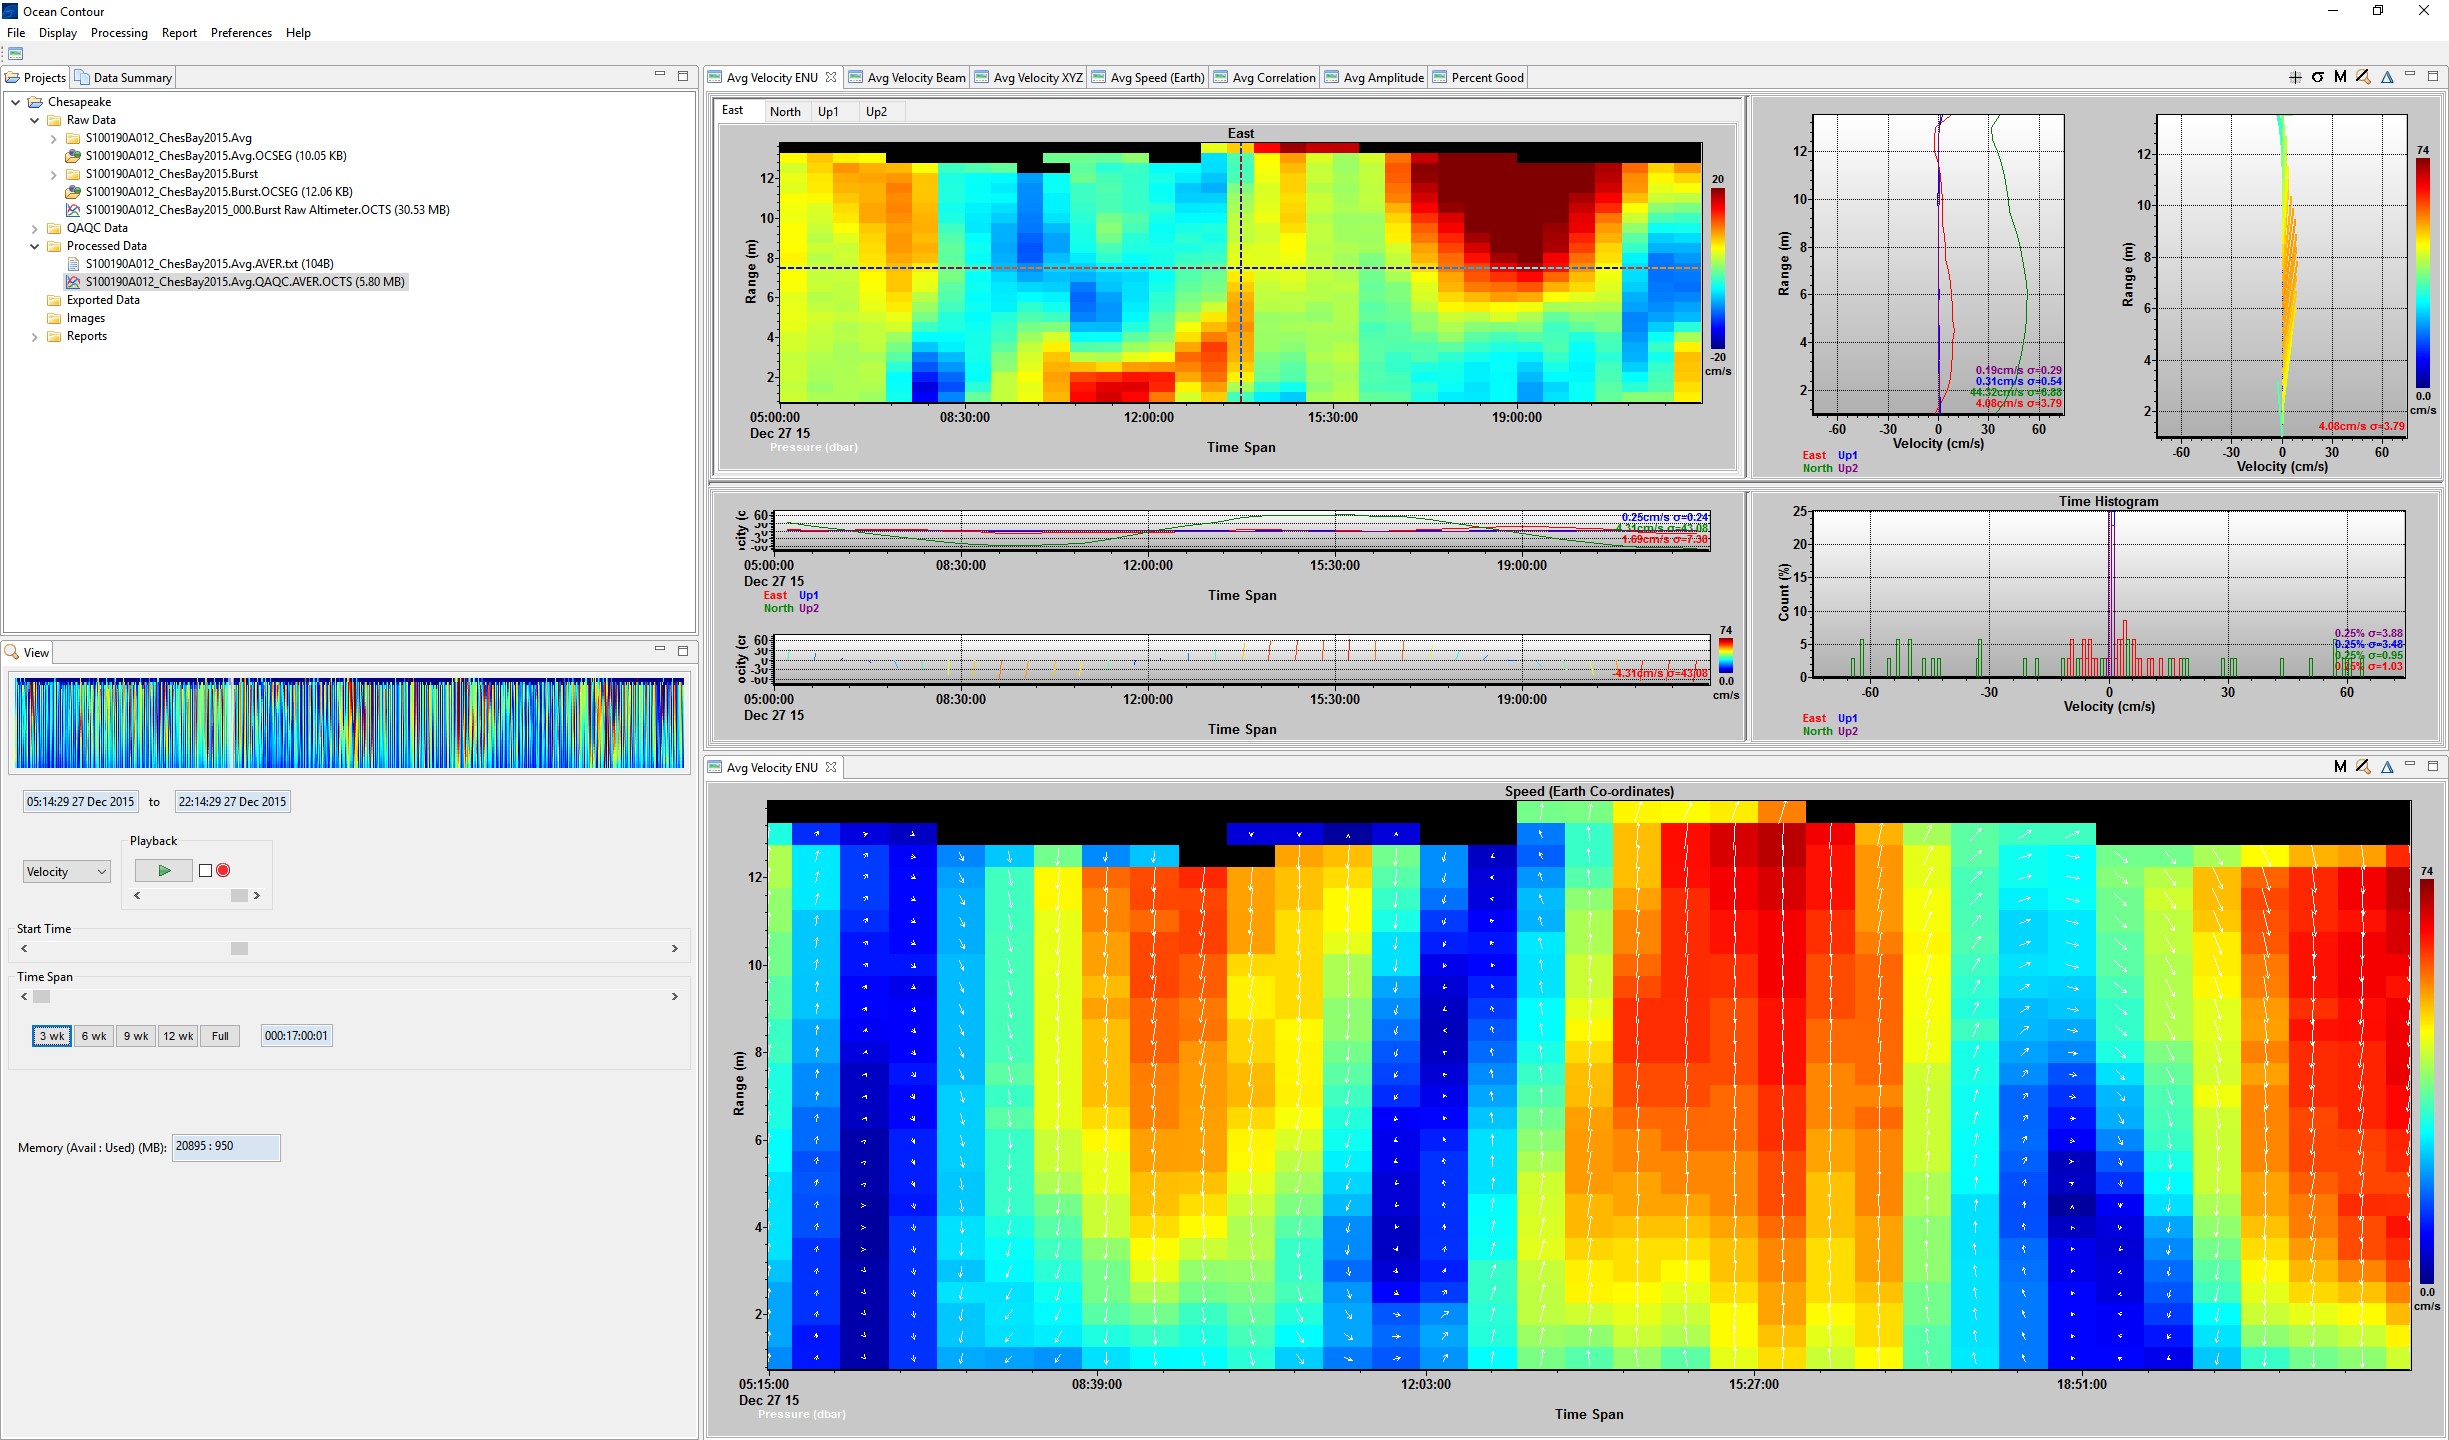
Ocean Contour: Signatures500 data averaged and saved in processed data file. Stick plots of the ENU data can also be created.
Produced by Boston-based company Ocean Illumination, the software, contains a strong visual component to help simplify data comparisons, while the graphics it produces can be readily exported to create presentations in widely used applications.
“It’s amazing just how much we are able to ‘see’ in the oceans these days,” says Atle Lohrmann, founder of Ocean Illumination. “Until now, there really haven’t been any companies dedicated to producing software for post-processing of oceanographic data, so Ocean Contour is an important tool in making sense of it all in a way that is accessible to the maximum number of users.”
Speedy processing of huge datasets
Key to the success of Ocean Contour is its ability to speedily handle and dissect these huge datasets in a variety of ways, picking apart complex, inter-related data in a way that can be easily displayed, analyzed and assessed for quality assurance.
To date, such data processing has largely been the preserve of specialized oceanographic scientists working with their own algorithms, usually on software designed for specific manufacturers’ equipment. Ocean Contour not only caters for such high-end work but also allows those with lower levels of expertise to extract valuable information from their data.
“Hand-crafting data processing toolkits is time consuming and error prone. This program provides a very easy way to process data from acoustic instruments without requiring much knowledge beyond being able to run a computer application,” says Robert Craig, Ocean Illumination’s Lead Software Developer.
Compatible with multiple instrumentation providers
The first version of the software is designed for use with the Signature series Acoustic Doppler Dual Current Profiler (AD2CP) instrumentation from Nortek AS, but future releases coming in 2017 will support data provided by different types of instruments, including those from other manufacturers. Ocean Contour also allows easy transfer of data to software based on Matlab, a core tool for oceanographic scientists developing algorithms.
This first iteration of Ocean Contour is just the start for Ocean Illumination, which plans to expand its offering in coming months, by adding modules for processing turbulence data and tidal analysis.