Reversing Gulf of Mexico Natural Gas Production Declines
U.S. Energy Information Administration
U.S. Energy Information Administration, Natural Gas Monthly
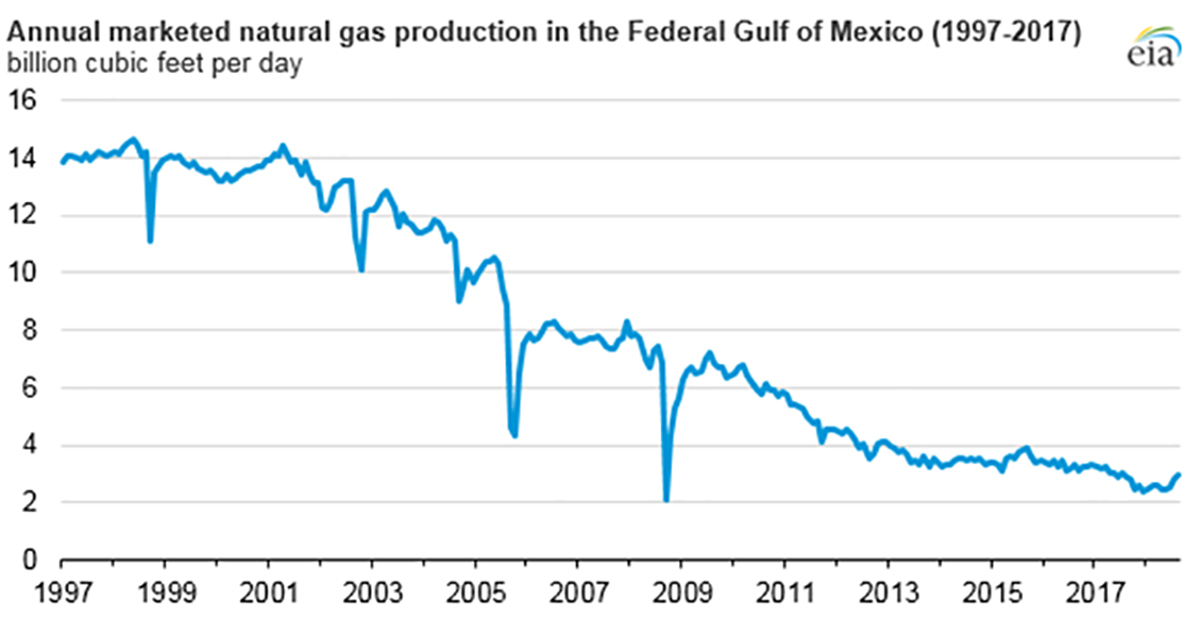
Natural gas production in the U.S. Federal Gulf of Mexico (GOM) has been declining for nearly two decades.
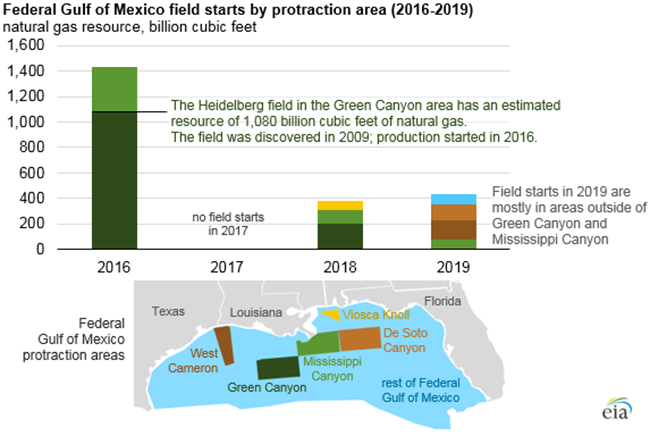
However, 10 new natural gas production fields are expected to start producing natural gas in 2018 and another 8 are expected to start producing in 2019, according to information reported to the U.S. Department of Interior’s Bureau of Safety and Environmental Enforcement. These new field starts may slow or reverse the long-term decline in GOM production. The 16 projects starting in 2018 and 2019 have a combined natural gas resource estimate of about 836 billion cubic feet.
Marketed natural gas production in the Gulf of Mexico averaged 2.6 billion cubic feet per day (Bcf/d) through August 2018, accounting for 4% of total U.S. production. In 1997, when EIA began collecting GOM production data, production averaged 14.3 Bcf/d, accounting for 26% of the United States’ total annual marketed natural gas production.
The decline in GOM natural gas production occurred as the number of producing natural gas wells in the GOM declined, falling from 3,271 in 2001 to 875 in 2017. The technology and expertise required to produce oil and natural gas from the seabed is expensive and specialized, and costs of production platforms can often exceed one billion dollars. With the growth in exploration and production activities in shale gas and tight oil formations, onshore drilling became more economic relative to offshore drilling.
Most of the natural gas produced in the GOM is associated-dissolved natural gas produced from oil fields. Although older oil wells in the GOM tend to have higher natural gas content, newer wells are more oil-rich, resulting in less natural gas per well. According EIA’s Natural Gas Annual, 59% of gross withdrawals of natural gas in the GOM were from oil wells in 2017, up from 13% in 1997.
The 16 new projects in 2018 and 2019 are the first in the GOM since 2016, when 5 projects in the Mississippi Canyon and Green Canyon protraction areas added 1,429 Bcf of natural gas resources. Twelve of the 16 new projects are located in Mississippi Canyon and Green Canyon protraction areas; the others are in the Western GOM planning area (such as West Cameron) or Eastern GOM planning area (such as De Soto Canyon or Viosca Knoll, among others).
 Source: U.S. Energy Information Administration, based on U.S. Department of Interior’s Bureau of Safety and Environmental Enforcement
Federal Gulf of Mexico field starts (2016)
| Field name | Water depth (ft) | Resource (Bcf) | Protraction area | Discovery year |
|---|---|---|---|---|
| Amethyst | 1,200 | 140 | Mississippi Canyon | 2014 |
| Gunflint | 6,138 | 7 | Mississippi Canyon | 2008 |
| Heidelberg | 5,271 | 1,080 | Green Canyon | 2009 |
| Kodiak | 5,006 | 12 | Mississippi Canyon | 2008 |
| Otis | 3,800 | 190 | Mississippi Canyon | 2014 |
Federal Gulf of Mexico field starts (2018-2019)
| Field name | Water depth (ft) | Resource (Bcf) | Protraction area | Discovery year | Production year |
|---|---|---|---|---|---|
| Big Foot | 5,235 | 14 | Walker Ridge | 2006 | 2018 |
| Stampede-Knotty Head | 3,557 | 10 | Green Canyon | 2005 | 2018 |
| Tahiti 2 | 4,023 | 7 | Green Canyon | 2002 | 2018 |
| Kaikias | 4,575 | 3 | Mississippi Canyon | 2014 | 2018 |
| Caesar/Tonga Phase II | 5,000 | 158 | Green Canyon | 2007 | 2018 |
| La Femme | 5,814 | 9 | Mississippi Canyon | 2016 | 2018 |
| Crown and Anchor | 4,252 | 73 | Viosca Knoll | 2016 | 2018 |
| Constellation | 4,472 | 30 | Green Canyon | 2015 | |
| Claiborne | 1,499 | 12 | Mississippi Canyon | 2015 | 2018 |
| Coulomb | 7,700 | 77 | Mississippi Canyon | 1987 | 2018 |
| Bushwood | 2,700 | 4 | Garden Banks | 2009 | 2019 |
| Gotcha | 7,844 | 11 | Alaminos Canyon | 2006 | 2019 |
| Phobos | 6,919 | 8 | Sigsbee Escarpment | 2013 | 2019 |
| Rydberg | 7,500 | 13 | Mississippi Canyon | 2014 | 2019 |
| Thunder Horse South | 6,050 | 75 | Mississippi Canyon | 1999 | 2019 |
| Tomcat | 1,200 | 150 | West Cameron | 2014 | 2019 |
| Vicksburg | 7,457 | 125 | Desoto Canyon | 2013 | 2019 |
| Buckskin | 6,923 | 58 | Keathly Canyon | 2009 | 2019 |
Principal contributor: Naser Ameen