Mapping the Ghost Fleet of Iron Bottom Sound
By: Garry Kozak, GK Consulting
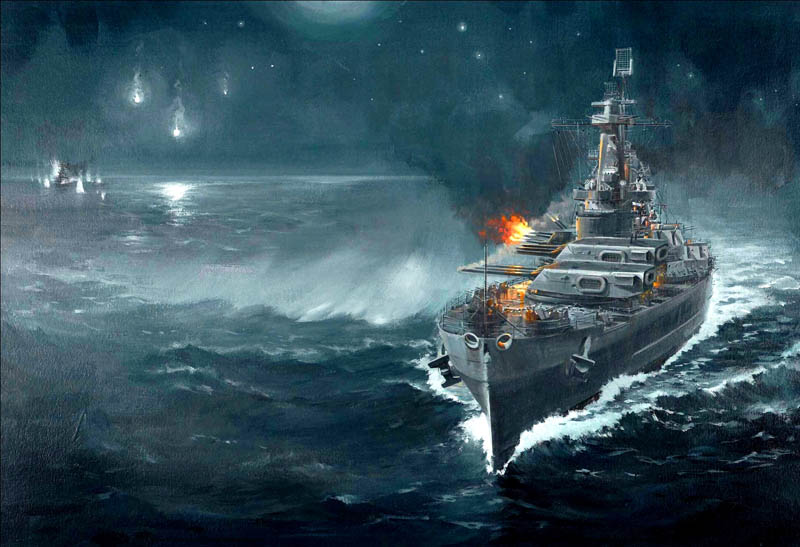
The Solomon Islands, a Pacific archipelago comprising 992 islands, is what one thinks of when you look for an untouched South Pacific island paradise. However, during WWII, it was the location of a major decisive battle that changed the tide of war with Japan. The famous “Battle of Guadalcanal” climaxed with naval battles that took place 12 to 15 November 1942. The result was a huge loss of life on both sides and the sinking of an estimated 50+ ships. It is precisely why the area off Guadalcanal after WWII was referred to as Iron Bottom Sound—the iron ships sitting on the seafloor.
The Project
Microsoft founder and philanthropist Paul Allen is a history buff on the events of WWII, and he has a keen interest in the Battle of Guadalcanal. Though Dr. Bob Ballard, with support of U.S. Navy assets, searched Iron Bottom Sound in the 1990s, he found only 13 of the estimated 50 ships sunk during the battles. Mr. Allen felt it would be a fitting tribute to those lost in the battles to definitively locate and map as many of the sunken ships as possible and to precisely position and document the resting place of the lost ships using the latest state-of-the-art underwater survey technology. A plan to map Iron Bottom Sound was outlined, and the project timetable was set in motion. A subsea operations team from Mr. Allen’s company, VULCAN Inc., would manage the AUV sonar mapping and ROV operations from the expedition yacht Octopus. The VULCAN subsea operations team, managed by Robert Kraft, was mobilized and met on 16 January 2015 in Honiara on Guadalcanal to meet the soon arriving Octopus.
Iron Bottom Sound Iron Bottom Sound is located 1,300 mi northeast of Brisbane Australia (Image 1). It is bounded by the Island of Guadalcanal to the south and the Florida Islands to the north. To the northwest is Savo Island, around which the major naval battles took place during WWII. This would be the area that would be mapped and explored during the mission since this area held the greatest concentration of sunken ships. Water depths within the area to be surveyed range from 600 m in east of the island and to a maximum of 1,350 m west of Savo Island.
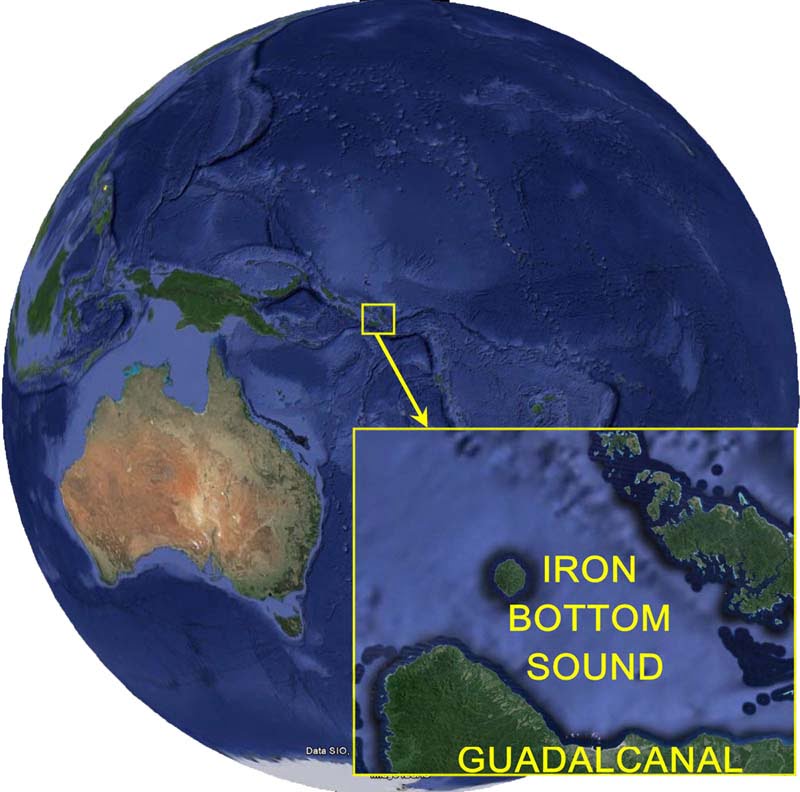
Image 1. GE Iron Bottom Sound.
AUV Side-Scan Sonar Mapping
Sonar mapping operations used a Bluefin 1,500-m rated AUV (Image 2) equipped with an EdgeTech 2205 side-scan sonar payload operating at 100 and 400 kHz. EdgeTech sonar was chosen because of the proven deepwater, high-performance track record; three EdgeTech Sonar systems are currently being used for the search for the mysterious disappearance of Malaysian flight MH370 in the Indian Ocean. The 100 kHz would be used for the long-range mapping to locate the shipwrecks and aircraft. The 100 kHz has an effective range of 600+ m per side, allowing swath widths of 1.2 km (Image 3). This long-range performance along with the ±5 m AUV navigation accuracy would allow survey line spacing of 1,100 m to be used, thus maximizing seafloor coverage rate.
Commencing the evening of 16 January, AUV operations were run 24 hrs around the clock with 20-hr missions and 2 to 3 hrs turn-around time on deck to swap AUV batteries, download data, and program a new mission. The benefit of using the Bluefin AUV for side-scan sonar surveys is clearly evident in the sonar data quality and the final mosaic map product. Survey lines are absolutely straight, and the AUV maintains the optimum height above the seafloor for the sonar by terrain following at a set altitude. The AUV missions ran very smoothly with only minor glitches during the 10 days of operations.
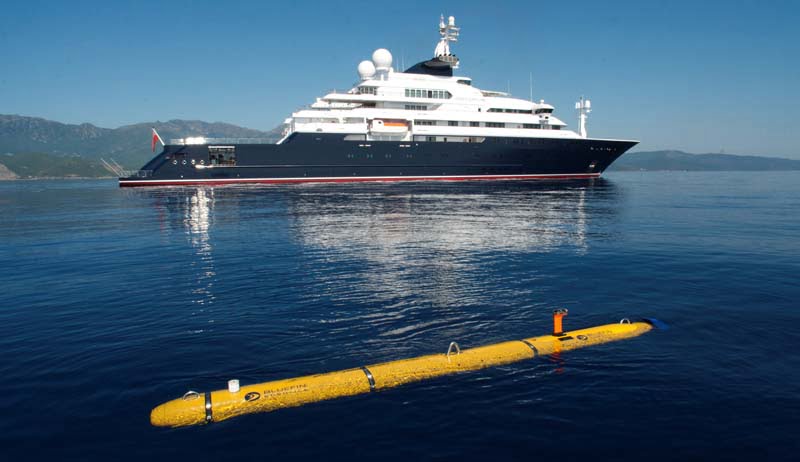
Image 2. Bluefin AUV Launched from Octopus. Photo Credit Paul Mayer.
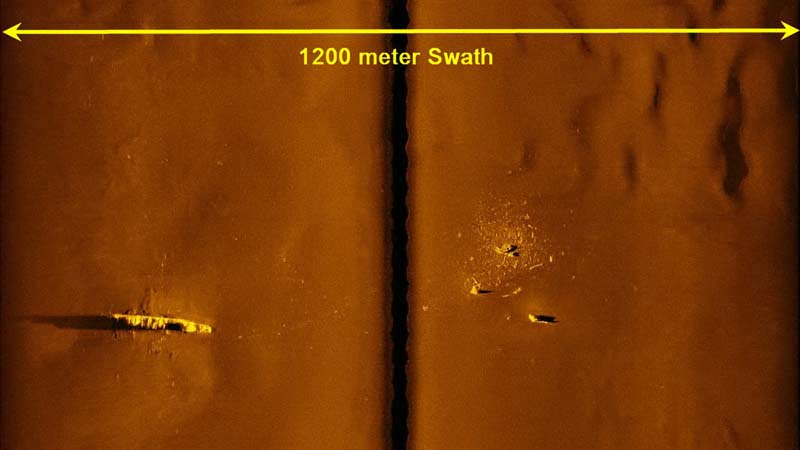
Image 3. Edgetech 100kHz showing 1.2 Km swath.
Sonar Data Processing
The EdgeTech side-scan sonar data were downloaded after the completion of each AUV mission and then processed into a GIS mosaic map and analyzed for shipwrecks and targets of interest. Chesapeake Technologies SonarWiz software was used because of its high-quality product output as well as its analysis and reporting tools, which simplified the handling of the many targets located during the project. Total area mapped during the 10-day project was 380 sq. mi. The SonarWiz mosaic (Image 4) showed a dynamic seafloor with many interesting geologic features. The shipwrecks and targets of interest were all logged, measured, positioned, and classified in SonarWiz.
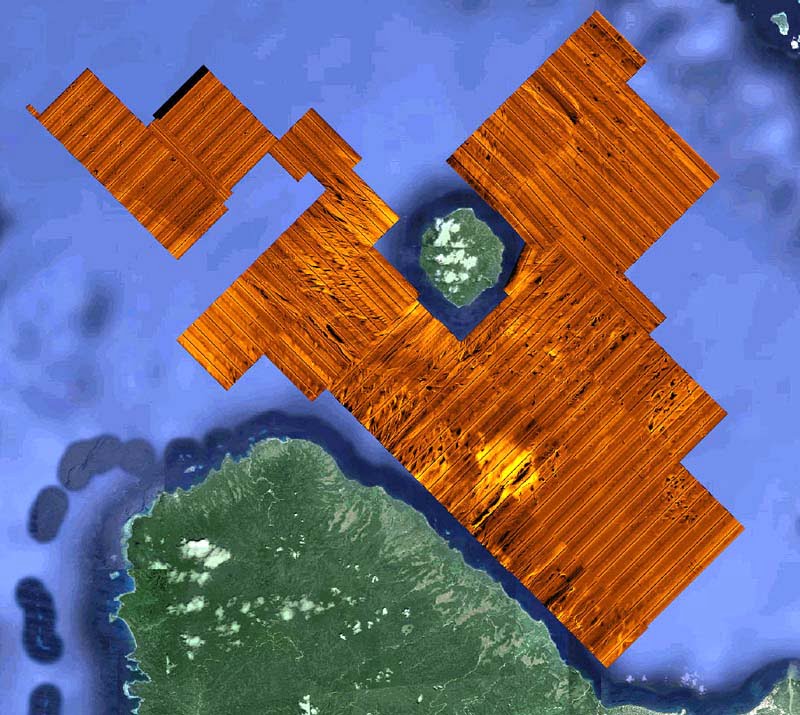
Image 4. SonarWiz Side Scan Sonar Mosic covering 380 Sq. Mi. of Iron Bottom Sound.
Shipwrecks Located
The sonar mapping produced a total of 29 wreck locations, 7 wreck debris fields, and several possible plane locations, one being confirmed (Image 5). Of the 29 wrecks located, 6 were positively identified: USS Astoria, USS Quincy, USS Vincennes, USS Northampton, HMAS Canberra, and the USS Atlanta. Eleven of the wrecks were tentatively identified using the analyzed sonar imagery with vessel measurements and location information from historical records: USS Walke, IJN Ayanami, USS Dehaven, IJN Yudachi, IJN Fubuki, USS Laffey, USS Monssen, USS Barton, USS Cushing, USS Little, and the USS Preston. The remaining 12 wreck locations were not identified and require further investigation to classify them. The 7 wreck debris fields did not provide enough information in the sonar data to classify them with any certainty beyond a debris classification.
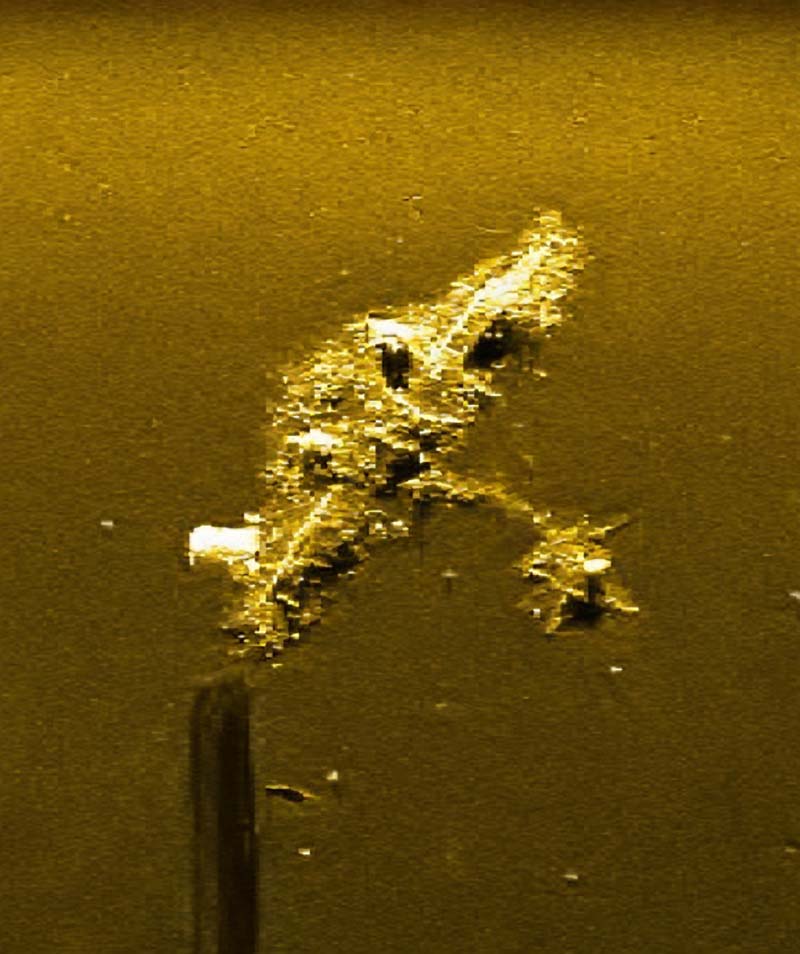
Image 5. ROV inspecting airplane.
ROV Operations
Select wrecks were chosen for inspection using the 3,000-m rated ROV (Image 6) on board the Octopus. These included the previously unfound USS Vincennes and the USS Astoria, both New Orleans class heavy cruisers. High-resolution side-scan sonar missions were run with the AUV before deployment of the ROV to map any possible obstructions or hazards that the ROV pilots should be aware of for safety concerns. The EdgeTech 400 kHz high-frequency sonar data produced extremely high-resolution images. When photographs of the ship were compared with the sonar image, every physical attribute of the ship seen in the photograph could be identified clearly in the sonar image (Image 7). The ROV operations were flawless, beaming stunning images of the ghost ships remains back to the operations center (Image 8). The streaming video showed a record of the battles and the horrific destruction of the ships and, of course, the men that manned them.
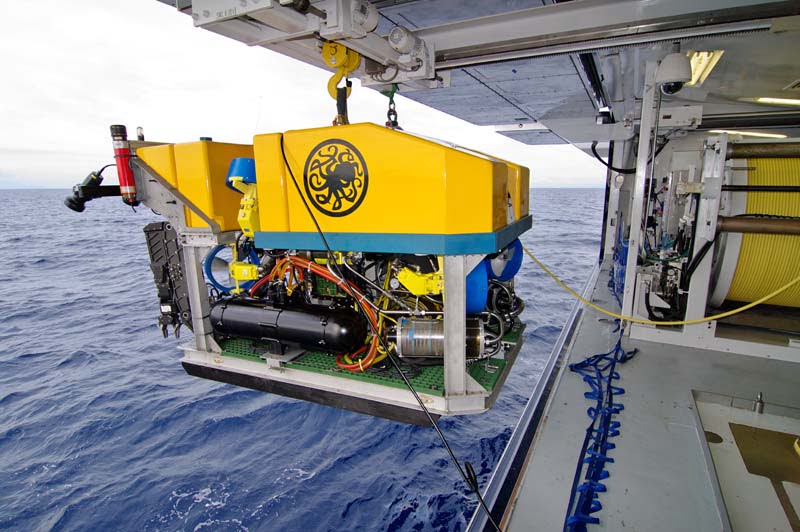
Image 6. 3000 meter rated ROV.
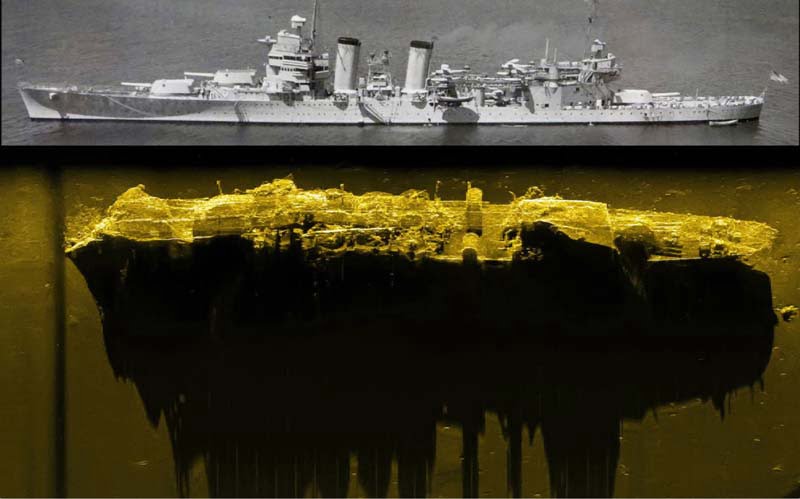
Image 7. Astoria Sonar Image compared to Photo Image.
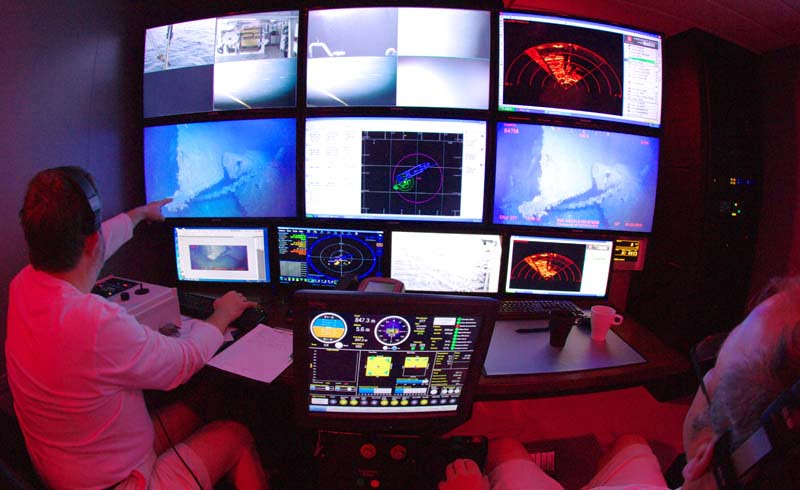
Image 8. ROV Ops Room.
Seeing the huge battleship turrets (Image 9) and the anti-aircraft guns ready for action (Image 10) told part of the story. Seeing the USS Astoria name clearly visible on her stern (Image 11) made it even more personal for the operations team knowing the violent history of her sinking. During the exploration of the USS Vincennes, a massive shell hole made by an 8-in. armor-piercing round could be seen in the stern of the vessel (Image 12), symbolizing the violence of the battle. Other battle scars observed by the ROV were the missing bows blown completely off of some of the ships. Shell and gun holes littered the vessels everywhere, and hulls could be seen ripped apart from massive explosions.
It was an eerie experience as the ROV cameras swam down the decks, peering into some of the open hatches and port holes. Occasionally, an interesting deepwater animal such as a Dumbo Octopus would swim into the camera view, making the scene even more surreal.
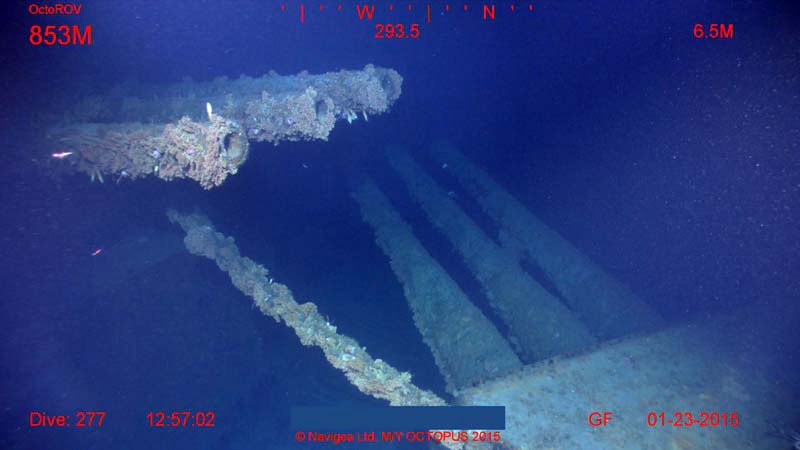
Image 9. Astoria Turret.
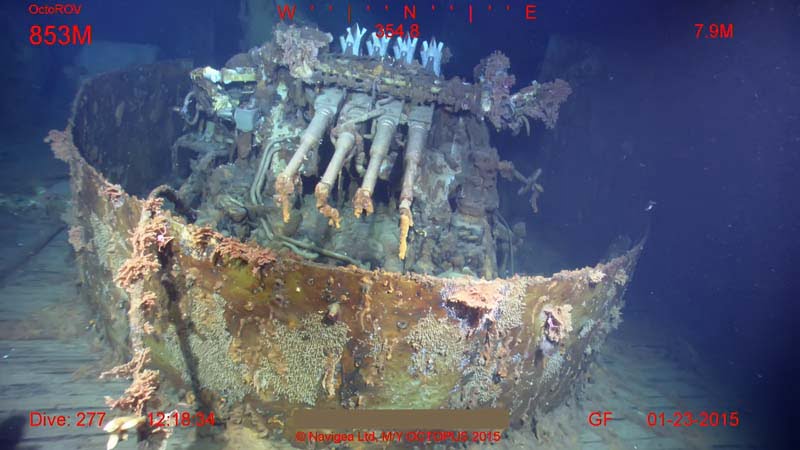
Image 10. Astoria Anti aircraft guns.
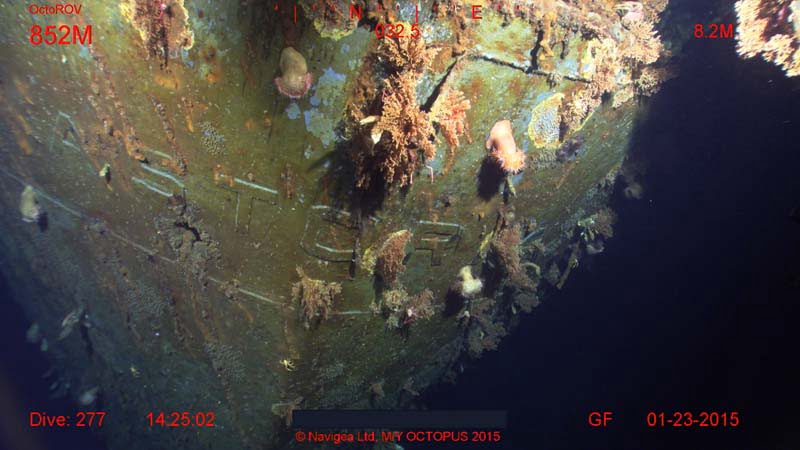
Image 11. Astoria Name.
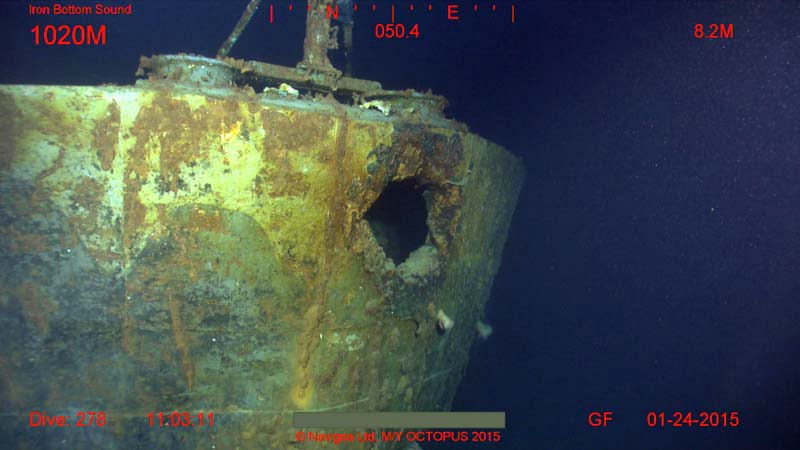
Image 12. Vincennes shell hole in stern.
Conclusion
The Iron Bottom Sound mapping mission accomplished all the goals set for the project. The major areas of the naval battle were successfully mapped, locating many of the previously unfound wrecks from the Battle of Guadalcanal. The positions of every wreck and feature were mapped to a precision of ±5 m, far more accurate than what has ever been accomplished of those wrecks found in the past. Some of these positions now show the error in historical records of where some of the sinkings were thought to have occurred. The ROV exploration produced many hours of amazing video, documenting the present condition of these long-lost ships of war. VULCAN will make available to the U.S. and Japanese navies the shipwreck positions, sonar data, and underwater video from this project to allow for amending the historical record of one of the greatest naval battles of WWII.
Each of the team members found moments during the mission to reflect on the sacrifices made by the men involved in these battles. It left an impression on each and every one of us.