Europe
Offshore Communications Backbone (OCB) – Cyprus
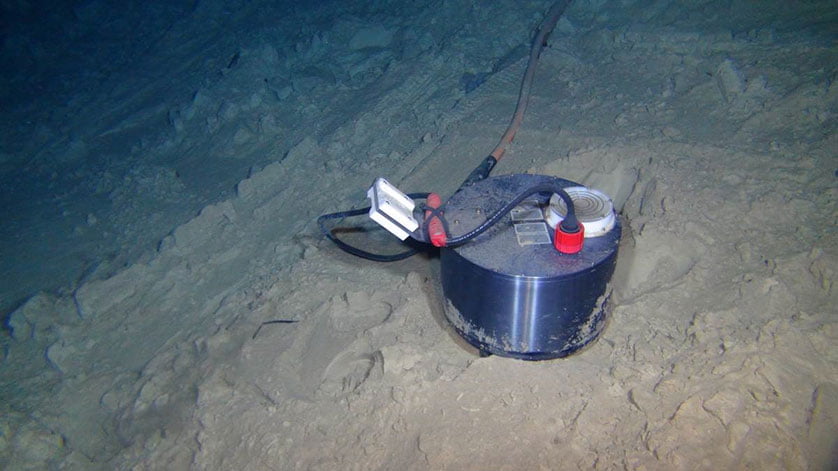
CSnet International is continuing to operate and maintain the OCB in the Exclusive Economic Zone (EEZ) of the Republic of Cyprus. Last year, CSnet entered into an agreement with the Institute of Geodynamics of the National Observatory of Athens (NOA) to provide seismic data from the OCB Ocean Bottom Seismometers (OBSs; Figure 1) to the European Integrated Data Archive (EIDA). EIDA is a federated European data center that archives and provides access to seismic waveforms and their related metadata. NOA is hosting the new EIDA node for seismic stations located in Greece and the southeastern Mediterranean. The near-term plan of operation is to continue implementing the node-pod maintenance operation initiated in 2014 with removal and replacement of the remaining two pods from the original deployment (at nodes 1 and 5).
PLOCAN – Canary Islands
The Oceanic Platform of the Canary Islands (PLOCAN) is a multipurpose technical-scientific service infrastructure that provides support for research, technological development and innovation in the marine and maritime sectors, available to public and private users. PLOCAN provides both onshore and offshore experimental facilities and laboratories, operational throughout the whole year thanks to the Canary Islands excellent climatic conditions. PLOCAN also brings a broad experience in large national and EU marine/maritime projects. Over the last year, the PLOCAN Integrated Ocean Observatory has been operated and improved with new infrastructures and equipment.
Offshore facility
The PLOCAN offshore-facility building (Figure 2), after two-year construction process in Las Palmas harbour, was successfully towed and moored on the 30th November 2016 at the planned location in the test-site area of the PLOCAN Consortium, located at the North-East of the island of Gran Canaria. Once on site, the following months have served to end with facility furnishing. Rightnow it’s almost ready to become fully operational is 2018 as key element of the PLOCAN´s test-site area.
Electrical and Communication grid Infrastructure (IECOM)
The evacuation of the electricity generated during the expected experimental assays in PLOCAN Marine Test Site will be done through the Electrical and Communication grid Infrastructure (IECOM). In June 2016 PLOCAN published a public tender for the construction and putting into service of the IECOM to operate in the PLOCAN Test Site. The IECOM will be operative in 2018 including two main modules of 5 MW of electricity evacuation capacity. Module 1 will be dedicated to wave energy converter demonstrators, with 5 positions of 1 MW each. Module 2 will be dedicated to offshore wind technologies with one position of 5 MW. Regular sea-operations are covered by PLOCAN’s own boats as part of the main equipment available.
Open Ocean Observatory (ESTOC)
The European Station for Ocean-Time-Series (ESTOC), that represents the deep-ocean node of the PLOCAN Integrated Ocean Observatory, has been served twice over the last year with a new mooring facility and updated ocean-sensor payload configurations, highlighting two sediments traps and a new generation of autonomous phytoplankton sampler (PPS). The mooring facility includes a surface buoy with a large meteorological and oceanographic set of sensors, which data gathered are made available in real-time, with open access through EMODNet. During this period, the ESTOC facility has keep successfully ongoing its Trans-National Access (TNA) program.
PLOCAN Glider Fleet
The fleet of gliders owned by PLOCAN has been improved and expanded with three new units of buoyancy-driven from different technologies, in order to rightly accomplish the operational and formative needs that require the use of these innovative and sustainable ocean-observation autonomous platforms. The PLOCAN glider-fleet is used both (1) to support the observation performed on a regular basis preferably in the set of areas of the PLOCAN Integrated Ocean-Observatory, among which stands out the seasonal program in ESTOC, (2) as open platforms where to integrate and test new sensors and subsystem components and (3) to make available for highly specialized training purposes through the PLOCAN Glider School.
Flag-ship international projects in ocean observation
Over the last year, PLOCAN has been directly involved in European flag-ship projects related to ocean observation, highlighting AtlantOS, NeXOS and AORA-CSA. AtlantOS (Optimizing and Enhancing the Integrated Atlantic Ocean Observing System) is led GEOMAR with the overarching objective to achieve a transition from a loosely-coordinated set of existing ocean observing activities producing fragmented, often monodisciplinary data, to a sustainable, efficient, and fit-for-purpose Integrated Atlantic Ocean Observing System (IAOOS). The NeXOS project (Next generation, cost-effective, compact, multifunctional web enabled Ocean Sensor Systems Empowering Marine, Maritime and Fisheries Management), is led by PLOCAN and has the main aim to improve the temporal and spatial coverage, resolution and quality of marine observations through the development of cost-efficient innovative and interoperable in-situ sensors deployable from multiple platforms, and Web Services for a key domains and applications. The AORA-CSA (Atlantic Ocean Research Alliance Support Action) project is designed to provide scientific, technical and logistical support to the European Commission in developing and implementing trans-Atlantic Marine Research Cooperation between the European Union, the United States of America and Canada. The Coordination and Support Action (CSA) is carried out within the framework of the Atlantic Ocean Research Alliance as outlined in the Galway Statement on Atlantic Ocean Cooperation (May 2013). PLOCAN leads the work package related to Ocean Observation.
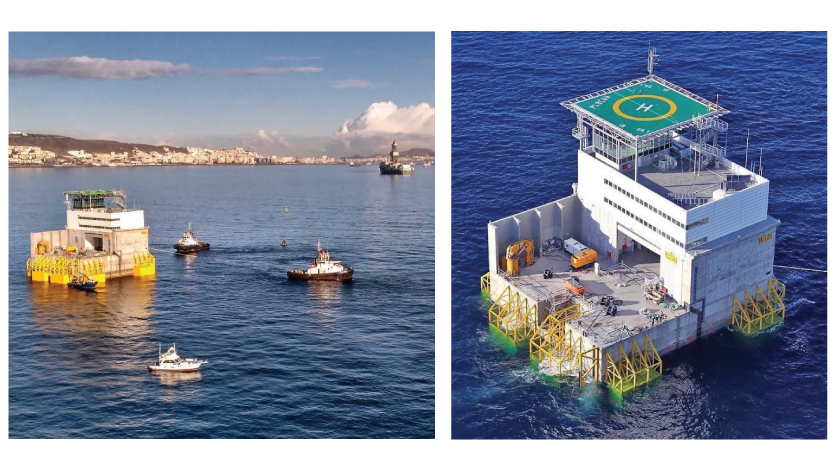 Figure 2. POLCAN Offshore Facility
The Americas
North America
U.S. IOOS – Integrated Ocean Observing System®
The U.S. Integrated Ocean Observing System (IOOS®) continues working to strengthen international partnerships and connections to help build the capabilities of ocean observing systems in the U.S. and globally.
Building effective and efficient paths to share and access data is critical to that mission, and to that end IOOS launched several new or enhanced products in the last year. The redesigned IOOS Data Catalog features daily metadata updates and a streamlined user interface, along with an automated process to ingest new datasets and features a CS-W service to allow for machine-based queries.
IOOS also released two major new tools, the Environmental Sensor Map and the Environmental Data Server (EDS). The Sensor Map connects to over 32,000 stations providing the latest information on oceanographic and meteorological conditions and integrates regional, national, and global real-time data. Individual stations and sensors can be selected when zoomed in and dynamic graphs provide overview statistics for individual sensors or regions. The EDS is a platform for visualization and analysis of integrated model output. Users can examine several modeled variables together in a map-based environment, generate time-series plots of the output, and compare with real-time data. The EDS also provides data access services through a THREDDS (THematic Real-time Environmental Distributed Data Services) server, which is available through the Viewer.
A new resource, the IOOS Data Demo Center, was launched to complement these and future updates and enhancements by providing code notebooks and video tutorials for using IOOS and IOOS Regional Association portals, tools, and data.
The Marine Biodiversity Observation Network (MBON)
Efforts to establish a sustainable biodiversity observing network in the U.S. and globally have taken great strides in the last year, both in continuing work on the three U.S. demonstration projects and in forging international partnerships to secure multi-national participation. Assessing ocean biodiversity and how it will change under possible future scenarios provides the basis to more effectively conserve and sustainably use marine life within and beyond areas of national jurisdiction.
The three U.S. pilot projects – Arctic MBON, Sanctuaries MBON, and Santa Barbara Channel MBON – entered their third year and are collaborating to develop common methods and standards as models for a national network. In 2016, they made major advances in developing a relational online biodiversity data portal and enrolling datasets provided by multiple independent programs, including the Long-Term Ecological Research (LTER) program, fisheries (e.g. NOAA’s Fisheries Science Centers), and state resource managers (e.g. Florida Fish and Wildlife Research Institute). The MBON Data Portal, launched in early 2017, provides open access to real-time, delayed-mode, and historical data for in situ and remotely-sensed physical, chemical and biological observations as well as biodiversity indices for certain datasets.
Significant progress was made internationally as well with the signing of a letter of agreement between Group on Earth Observations (GEO) BON/MBON, Global Ocean Observing System (GOOS) biology and ecosystems (BioEco) and Ocean Biogeographic Information System (OBIS) to collaborate on development of a sustained, coordinated, global ocean system of marine biological and ecosystem observations. This agreement establishes an ongoing collaboration between these entities to build a global, sustainable system that will share resources and strengths and ensure compatibility across all three. In addition, late 2016 saw the launch of MBON Pole-to-Pole in the Americas, an initiative to link regional observing networks in the Atlantic and Pacific to create an integrated picture of ocean status from the Arctic to the Antarctic. In early 2017, the US MBON Team began work on data products to address specific targets of the UN Sustainable Development Goal #14, “Life Below Water”. The team is developing prototype products that are applicable at the local level, answer questions of local coastal zone and conservation area managers, and can be scaled to address multiple SDG targets. The team will introduce these products during an MBON side event at the Group on Earth Observations’ “GEO Week 2017” in Washington, DC.
The U.S. National Animal Telemetry Network (ATN)
In 2017, the Animal Telemetry Network, a multi-agency partnership (NOAA, the Office of Naval Research (ONR), the Bureau of Ocean and Energy Management (BOEM), and select academic laboratories) continued efforts to advance the national capacity to observe and track the movements and behavior of aquatic animals and their habitats. Animal Telemetry variables include biological measurements as well as physical oceanographic measurements for the environments the animals pass through, expanding and enhancing the capabilities of existing ocean observing networks and ocean modeling and forecasting, marine planning, and ecosystem management. Closer ties to the MBON program were laid down this past year as both the ATN and MBON project leads began exploring ideas for a framework that would form the biological component of IOOS.
In December, the White House Office of Science and Technology Policy released the U.S. Animal Telemetry Network Implementation Plan. Animal telemetry data is widely collected by U.S. researchers, but often independently maintained and stored, which complicates access and wider research with multiple data sets. With this Plan for implementation, the Animal Telemetry Network sponsors are recommending that best practices and data standards be designed to build an integrated, connected network. One objective of the Plan, the creation of a national ATN Steering Group to provide guidance and leadership on the development and implementation of the ATN Plan, has already been met. In June, the ATN Steering Group, comprised of 13 members from federal government agencies and non-federal sectors, held their first full meeting at IOOC headquarters in Washington, D.C.
The Plan also calls for a series of regional workshops to be conducted in the U.S. to identify regional and national observation priorities, inform a concise plan for sufficient funding of the envisioned national ATN tagging program, including infrastructure and operations, and plan for how integration and coordination of these assets will be achieved. Initiated this year, these meetings also include representatives from the commercial sector and resource management agencies to highlight local stakeholder needs.
Strategy for a Sustained Network of Coastal Moorings
U.S. IOOS and the National Data Buoy Center released the National Strategy for a Sustained Network of Coastal Moorings. The Strategy is the result of a focused effort by NOAA and nonfederal partners to define a framework for the planning and implementation of a sustained network of coastal moorings in U.S. waters (Figure 3). Increased dependency on coastal moorings for effective coverage became evident when project-funded buoys were removed from the water as the projects concluded, immediately creating gaps in area networks which spurred the creation of the framework document. The long-range vision is of a core network of federal and nonfederal moorings, integrated with other environmental observing systems that will contribute to improvement of resource management, safety of life, protection of property, enhancement of the economy, and scientific understanding of the coastal system.
The development team identified 370 existing coastal moorings within scope of the Strategy: intended for long-term operations and located within the U.S. Exclusive Economic Zone (EEZ). Of these, 90% are operated by NOAA and IOOS Regional Associations; 215 are operated by federal entities (NOAA and USACE) and 155 by nonfederal entities (primarily, IOOS Regional Associations and their partners). The Strategy examines this existing inventory and provides 10 recommendations towards the implementation of a core network. The primary recommendation is to gather regional, diverse stakeholders’ input on regional observing gaps best addressed with coastal moorings, ensuring that the network addresses real needs and utilizes available resources efficiently and effectively.
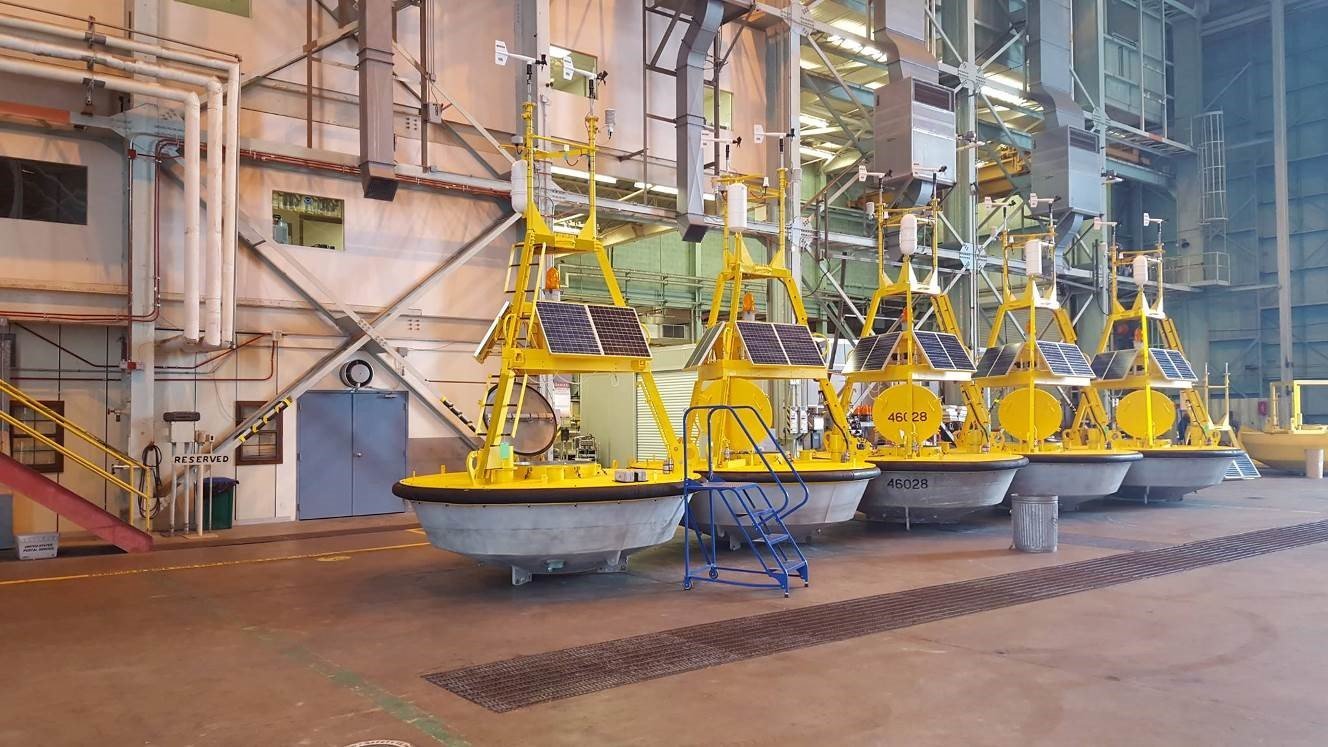 Figure 3. Discus buoys being readied for deployment (courtesy NOAA/NDBC).
SCCOOS – Southern California Coastal Ocean Observing System
Approximately 26,000 commercial vessels participate in the Marine Exchange of Southern California and Vessel Traffic Service of Los Angeles per year. Combined, the Port of Los Angeles and the Port of Long Beach are the busiest ports in the United States for vessel transport. Oceanographic parameters are extremely important in assuring the safety and operations of vessel traffic. With support from the California Department of Boating and Waterways, and NOAA’s National Ocean Service three wave buoys provide data for the maritime operations in the San Pedro Bight (Figure 4). These buoys are operated by the Coastal Data Information Program (CDIP) and the SCCOOS, based at the Scripps Institution of Oceanography, University of California, San Diego. The wave buoys are used for both real-time operations and wave model validation. They contribute towards maritime operations for a vast variety of traffic including the tugs and barges, ferries, harbor pilots, offshore oil terminal operations in El Segundo, the US Coast Guard, commercial fishing and recreational boaters. By monitoring these conditions, SCCOOS can provide the Los Angeles/Long Beach pilots and the local mariners with an accurate nowcast and forecast to help prevent hazardous operations.
Under Keel Clearance (UKC) Project
These buoys specifically support the Under Keel Clearance (UKC) Project at the Port of Long Beach. Due to the size of the vessels and the depth of the channel, maintaining the bottom clearance can be challenging. However, the transit of increased depths will reduce lightering operations offshore and air emissions. This project continues to analyze the safety for tanker transits with a deadweight vessel over 175,000 DWT. Up until May, 2017, vessels entering the port were required to have a 10% clearance under their keel, and no vessels could enter the Port with a draft over 65ft. As of Jun 11, 2017, five 66 ft vessels and two 67 ft vessels have successfully entered the Port. Additionally, 67 ft vessels are expected as conditions permit.
The UKC Project, in its third year of operation, has many partners. The Dutch based firm, PROTIDE, hosts a customized product standardizing environmental observations and forecast for the Port. The National Weather Service and National Center for Environmental Prediction (NCEP) have developed a series of high resolution, near shore wave models called the Nearshore Wave Prediction System (NWPS), providing accurate forecast guidance of waves and swell for the Southern California Bight. In addition, the Office of Coast Survey conducted a full bottom coverage hydrographic survey. The PROTIDE UKC system uses existing astronomical tide predictions from the existing observational water level station located in the Port of Long Beach provided by Center for Operational Oceanographic Products and Services (CO-OPS).
Swell Vulnerability
The unique geography of this area makes the ports extremely susceptible to wave energy. Based on long-term measurements from the San Pedro Buoy, the most frequent swell direction is from the west and the second most common swell direction is from the south. There is minimal protection or island shadowing from the Channel Islands from the west or south. South swells are most common in the summer months and west swells are most common in the winter. In addition to the lack of protection from the Channel Islands from west and south swells, the bathymetry tends to channel wave energy directly into the ports. The deep channel between Santa Catalina Island and Los Angeles provides the perfect funnel for high south swell events into the port. It is expected that NCEP validation of the wave model will take at least one more year to fully capture the complete range of wave approach.
Realizing the safety, environmental and economic impact of this project, there are many local, state and federal partners involved with the UKC Project: Jacobsen Pilots, Tesoro, the National Ocean Service, the National Weather Service, State of California Oil Spill Prevention and Response, the US Army Corps of Engineers and the California Department of Parks and Recreation. The Marine Exchange of Southern California serves as the administrator for the project. Data from these buoys are available through the custom CDIP display for the Marine Exchange, the NOS PORTS website and National Weather Service (NWS) National Buoy Data Center (NDBC) website. For further information email [email protected].
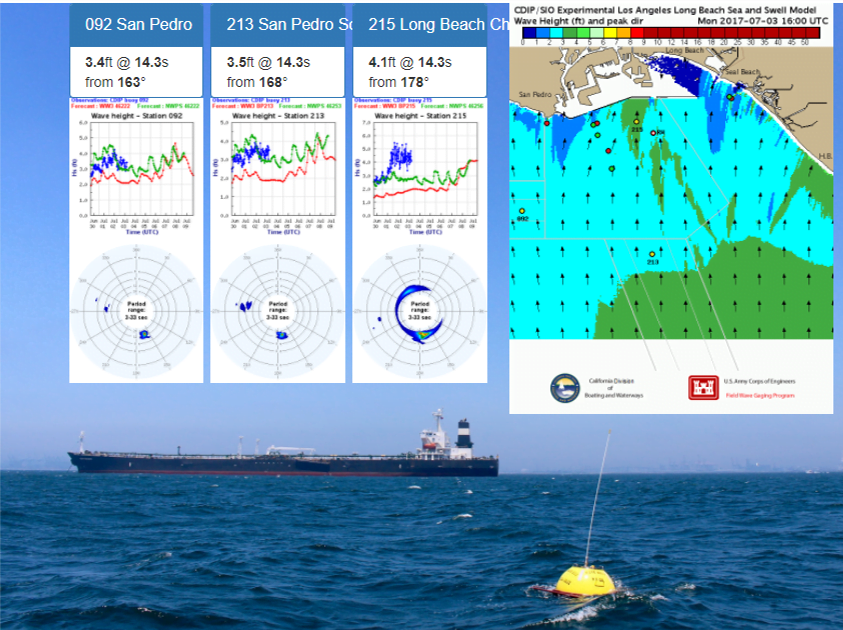 Figure 4. At the Port of Long Beach and Los Angeles, Bar Pilots use this multi buoy display daily for accurate wave measurements. The red line shows the predicted global Pacific WaveWatch III forecast model. The blue line shows the real-time observations at the buoy. The green line is the new Nearshore Wave Prediction Model (NWPS). This image shows the WaveWatch III underprediction of the south swell at all three sites, and the NWPS underprediction particularly at the Long Beach Channel Buoy, highlighting the need for continued wave buoys to support model validation.
AOOS – Alaska Ocean Observing System
Ocean Acidification in ALASKA
Increasing interest across the state about the potential impacts of Ocean Acidification – or OA – on fishing communities and the environment, is driving local efforts to help expand our understanding of OA throughout the region. The Alaska Ocean Observing System (AOOS) is leading a newly formed Alaska Ocean Acidification Network, connecting scientists and stakeholder communities throughout the state to inform and educate communities at risk, identify knowledge gaps, recommend regional research and monitoring priorities, and share information and data. Regional associates who have a stake in OA issues include fishermen, shellfish growers and communities that rely on marine resources for their livelihoods.
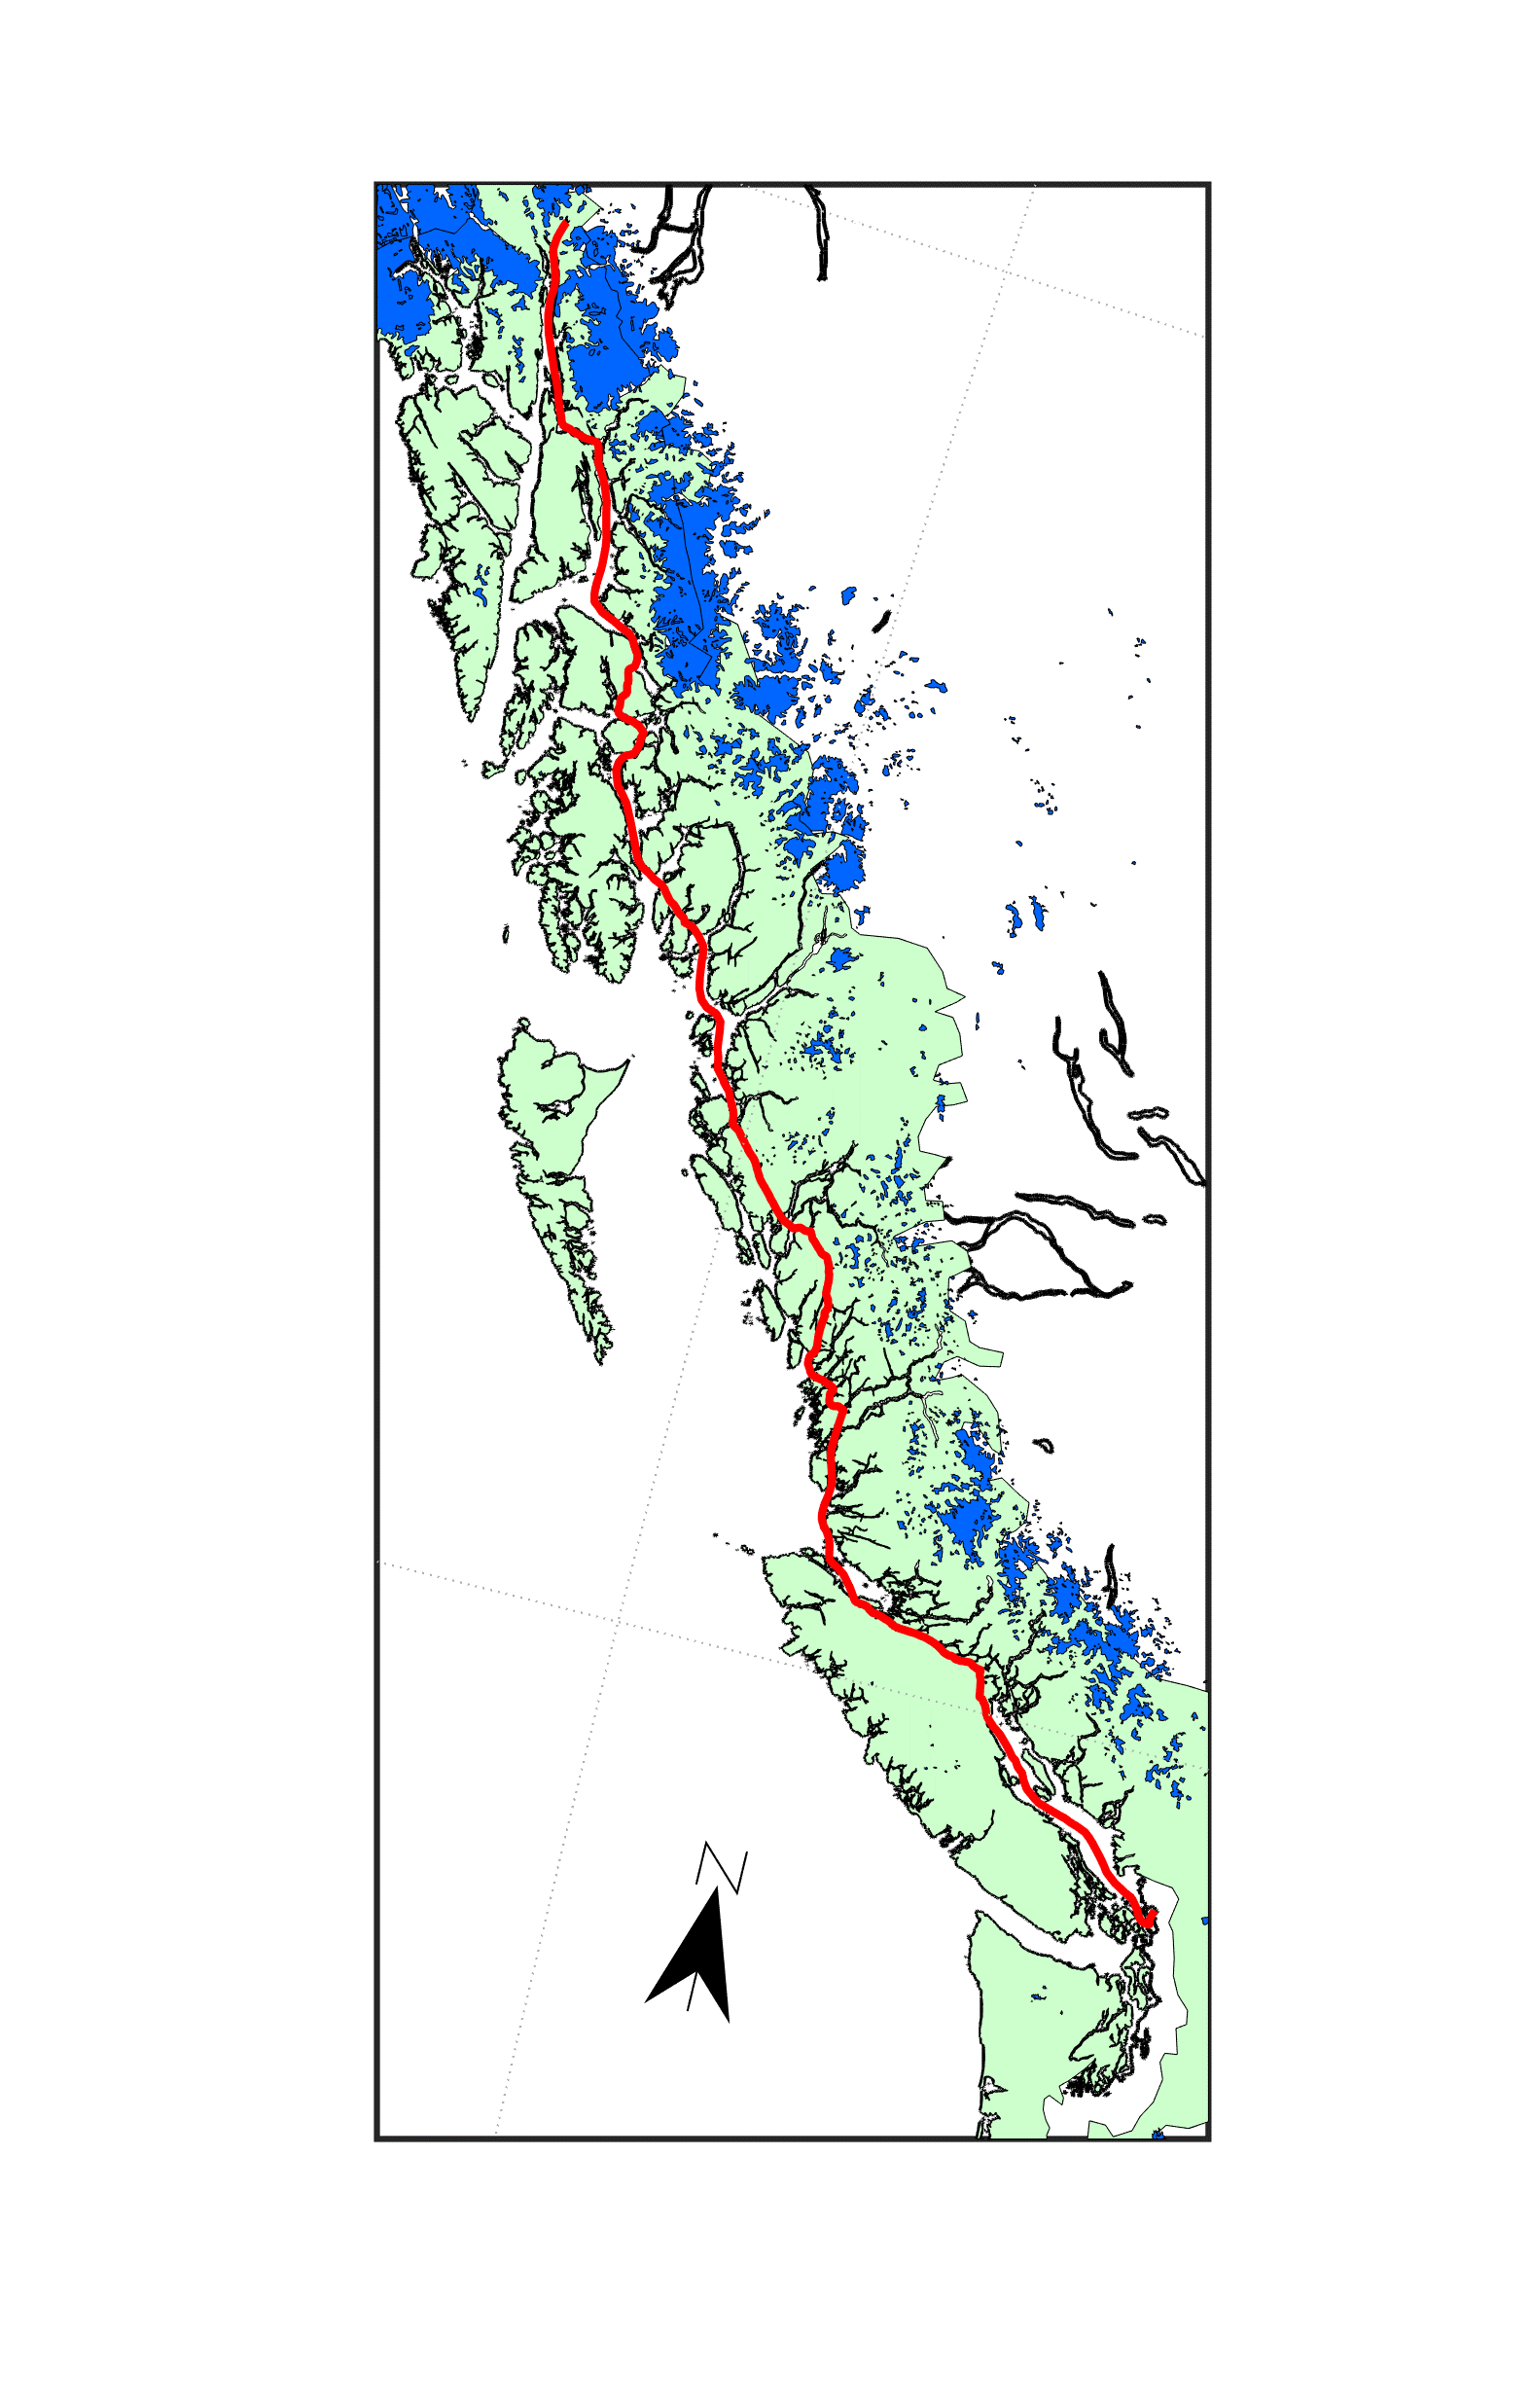 Figure 5. Track of the AMHS ferry M/V Columbia between Bellingham, WA and Skagway, AK. Green land areas are coastal rainforests and blue are glaciers. The region represents a wide variety of freshwater runoff sources and conditions.
OA monitoring activities in Alaska are varied and range from long-term, shore-based continuous sampling platforms and moorings to shorter duration and limited spatial shipboard observations and glider surveys. To aid in the understanding of OA conditions and variability along the Southeast coast of Alaska and British Columbia, an agreement with the Alaska Marine Highway System is allowing the Alaska state ferry M/V Columbia to be used as a platform to make much needed spatial and temporal OA observations in this region. The Columbia operates from Bellingham, Washington to Skagway, Alaska on a weekly basis from April through October and will make core oceanographic measurements using a continuous sampling General Oceanics 8050 pCO2 Measuring System (Figure 5). Observed variables include temperature, salinity, pCO2 (partial pressure of carbon dioxide) and dissolved oxygen. These underway measurements are made every 2.5 minutes on seawater drawn from 3 meters below the surface through an intake line in the bow thruster cavity, and atmospheric pCO2 is measured from an air intake on the foredeck. The combination of these core measurements along with an alkalinity-salinity relationship built from data collected largely using prior AOOS funding, will allow tracking of the surface water saturation states of aragonite and calcite, as well as pH and the other CO2 system parameters along the ferry’s transit path. The complete system is scheduled to set sail in August 2017 and data will be relayed to shore via the Iridium satellite network. During its 3,000 km weekly roundtrip, this platform will provide the longest and most frequent repeat-track OA record in the world.
AOOS is a partner on this joint venture with the Tula Foundation-supported Hakai Institute (British Columbia, Canada), the University of AK Southeast’s Alaska Coastal Rainforest Center, the University of Washington Joint Institute for the Study of the Atmosphere and Ocean, and NOAA’s Pacific Marine Environmental Laboratory. To learn more about OA status and trends in Alaska, the concerns and issues facing the state and details about OA monitoring activities in region, click here.
Resorting to Space Physics Technologies to Make Shore Based Water Level Measurements
Accurate water level observations are fundamental for storm-surge forecasting, informed emergency response, ecosystem management, safe navigation, and efficient coastal and nautical mapping and charting. Alaska’s extensive and remote shorelines are critically under-instrumented for water level observations in part because they pose observational obstacles including the threat of ice, lack of coastal infrastructure and rapid coastal erosion. These conditions all can render conventional water level sensing technologies inadequate. AOOS is working on finding alternatives to expensive National Water Level Observation Network (NWLON) tide gauges, especially for regions that experience shore-fast ice, making these and similar in-water systems impractical.
ASTRA, LLC has developed and commercialized dual frequency GPS receivers that are used primarily for space weather monitoring activities, but are capable of making several other types of observations, including soil moisture, snow depth measurement, and ocean water level.
In cooperation with NOAA’s NWS and private industry research associate ASTRA, LLC, AOOS is now exploring the application and efficacy of using land-based GPS reflectometry measurement techniques as an alternative water level observation technology. In April AOOS installed two dual ASTRA GPS receivers in Seward, Alaska to test this technology (Figure 6). While AOOS’s main interest is water level, the receivers provide simultaneous measurements of both ocean tidal variation and ionospheric space weather, which is of interest to NOAA’s Space Weather Prediction Center as well as other government agencies and commercial operators of Positioning, Navigation and Timing (PNT) services. The purpose of the deployment is to demonstrate the performance of the ASTRA GPS receivers making water level measurements by comparing the observed data to high-quality water level measurements from the nearby NOAA-operated NWLON water level station (Number 9455090), located in the Seward harbor. Validation against high quality water level observations will determine if GPS reflectometry can provide the level of data quality required for water level data needs (e.g., safe navigation, storm surge modeling, water level and tide prediction). The GPS receiver’s operational capability in weather conditions experienced year-round in Alaska will also be evaluated prior to extending this technology to a broader monitoring network in more remote locations.
Preliminary comparison with the nearby NWLON data demonstrates the feasibility of deriving first order tidal data from GPS receivers (Figure 7). Early results are promising, and with a longer time series, the fidelity with which the GPS reflectance data can reproduce the NWLON-derived tidal constituent amplitudes and phases can be assessed. If successful, the goal is to install GPS receivers in under-sampled and remote regions. ASTRA has already developed a solar-powered and autonomous, Standalone System Support Module (SSSM) for such applications that provides shelter, power and communication capability to support and operate various sensors in areas where there is no shelter, power or Internet. The module includes an Iridium communications modem, which can be switched out with cell phone or other communications protocols as required by the deployment location.
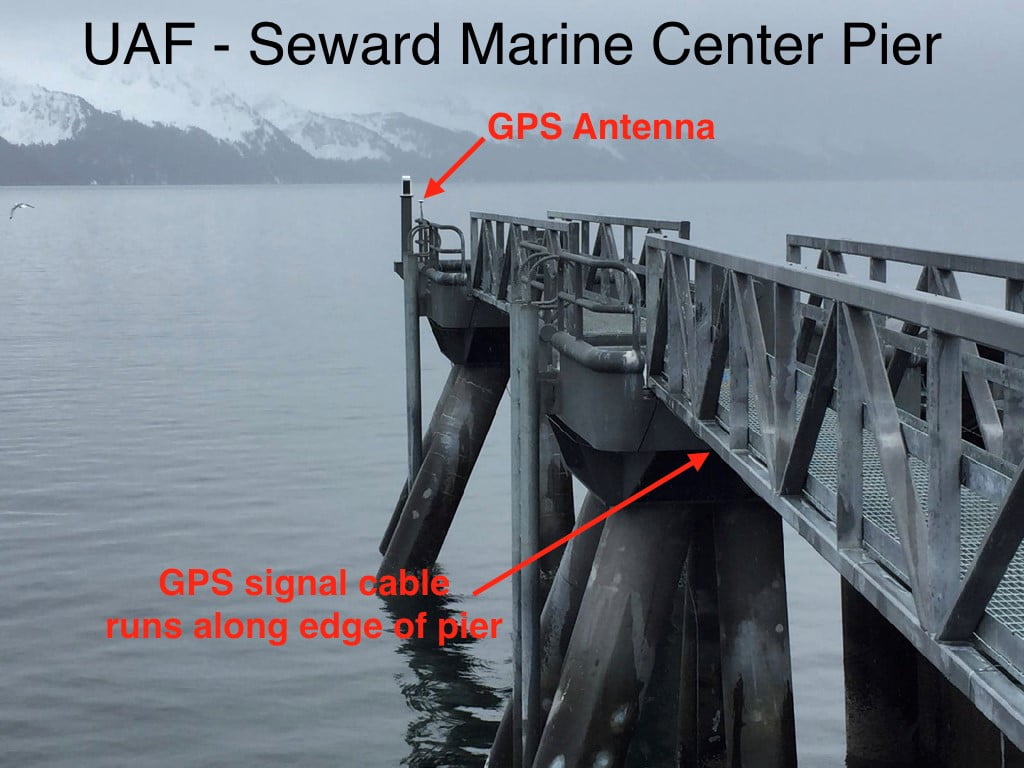 Figure 6. Photo showing the AOOS/ASTRA, LLC GPS Antenna installation site on the University of Alaska (UAF) – Seward Marine Center pier in downtown Seward, Alaska, April 2017.
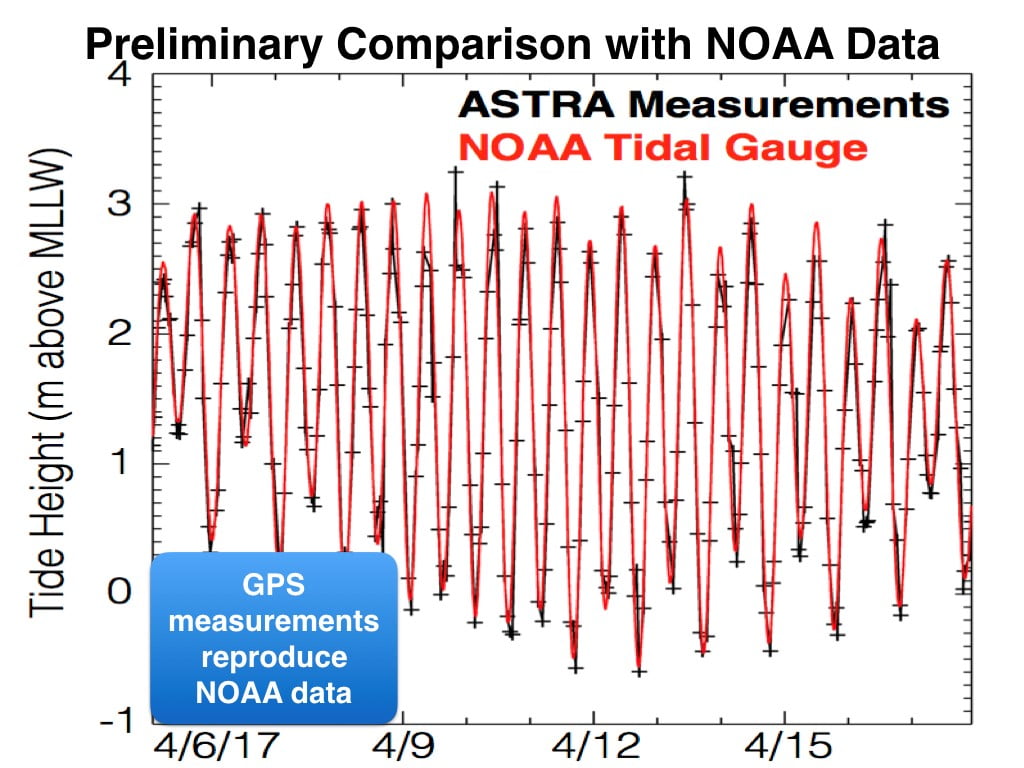 Figure 7. Time series showing the NOAA-NWLON Station 9455090 water level data (red line) with discrete ASTRA water level measurements (+ symbols) for the month-long period in Seward, Alaska.
ONC’s VENUS and NEPTUNE – Canada
Ocean Networks Canada (ONC) monitors the west and east coasts of Canada and the Arctic to continuously gather data in real-time for scientific research, helping communities, governments and industry make informed decisions about our future. Data from ONC’s innovative cabled seafloor observatories, moorings and coastal radars – combined with mobile data from ferries, gliders, and fish tag receivers – inform pressing scientific, industry and policy issues.
Over the last year, expansion of ONC’s seafloor observatories off the west coast of Canada included new earthquake early warning installations on the Cascadia subduction zone (Figure 8). Following the successful laying of a 3-km steel armored fiber optic cable at Clayoquot Slope, new installations include accelerometers, a tiltmeter built by RBR of Canada – which combines an accelerometer and bottom pressure recorder – and the connection of a Woods Hole Oceanographic Institution tiltmeter 30-m into the CORKed borehole. ONC partnered with Global Marine Systems and Ocean Exploration Trust to perfect complex dual-ship operations to lay heavy armored cable, point to point, in the deep ocean.
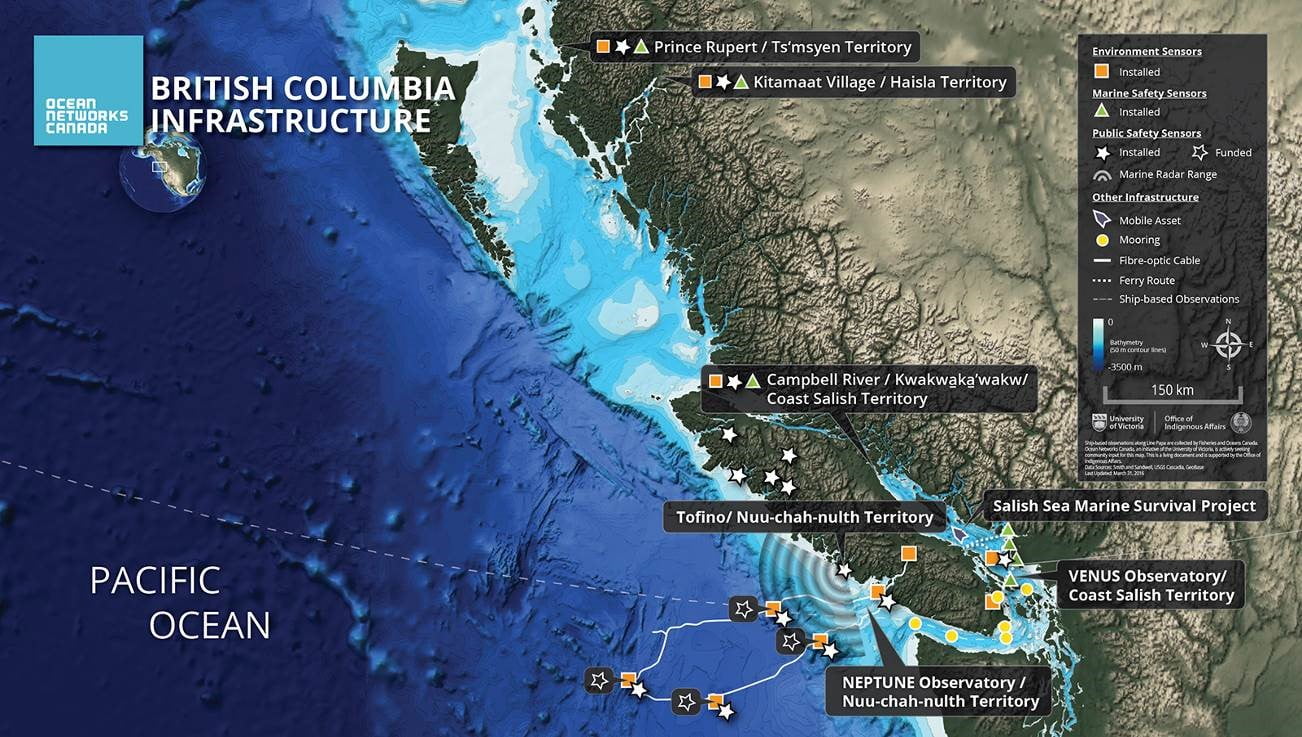 Figure 8. Map showing ONC’s expanded footprint.
ONC’s Smart Ocean Systems™ now includes four community observatories along Canada’s west coast and in the Arctic; seafloor instruments and sensors are complemented by land-based cameras, weather stations and Automatic Identification System (AIS) receivers for ship traffic monitoring. After celebrating their first year in operation, the three British Columbia community observatories now include nine land-based oceanographic radars along the west coast from Vancouver to Prince Rupert, supporting safer navigation, incident response, and tsunami detection. Celebrating six years in the Arctic, the Cambridge Bay community observatory continues to expand, while ONC’s partnerships in the north grow to support safe navigation, sea-ice modelling, and climate change studies.
ONC’s mobile sensors on BC Ferries expanded to include a sensor system for calibrating satellite data for ocean health monitoring. Participation in a triple glider project – in collaboration with Dalhousie’s Ocean Tracking Network and University of British Columbia with support from the Marine Environmental Observation Prediction and Response Network and Fisheries and Oceans Canada – mapped critical gray whale habitat off the west coast of Canada, and further increased ONC’s mobile asset data.
As Canada’s hub for ocean data, ONC’s freely accessible data archive is growing to include Fisheries and Oceans Canada data, Canadian Coast Guard AIS data to support real-time ship traffic information, and the Saturna Island Marine Research & Education Society hydrophone data.
Ocean Tracking Network – Canada
The Ocean Tracking Network (OTN) is a global research, technology, data management and partnership platform headquartered at Dalhousie University in Halifax, Nova Scotia, Canada. Since 2008, OTN has been deploying Canadian-made acoustic receivers and oceanographic monitoring equipment in key ocean locations and inland waters around the world. OTN is tracking more than 130 keystone, commercially important and/or endangered species such as marine mammals, sea turtles, squid, benthic crustaceans and fishes including sharks, sturgeon, eels, tuna, salmonids and cod.
OTN has established partnerships with a global community of telemetry users to document the movements and survival of aquatic animals carrying electronic tags (acoustic, satellite, radio, data archival) and show how they are influenced by changing environmental conditions. OTN users come from academia (universities and research institutes), federal management agencies and stakeholder groups (e.g., lands, water and natural resource agencies, fish and wildlife agencies, First Nations), industry (e.g., manufacturing and test facilities, fishing organizations, renewable power, national space agencies) and the private sector (e.g., aquaria, museums, tourism associations). Currently, 398 international researchers from 30 countries are participating in the global network along with many more trainees, graduate students and postdoctoral fellows (Figure 9). In Canada alone, OTN has directly supported more than 260 students and trainees.
OTN’s Canadian research is focused on contributing to evidence-based resource management through the integration of natural and social science components, including knowledge mobilization and exchange. The knowledge generated by OTN scientists, in addition to providing discovery science, helps inform government resource management and policy development. Government decision-makers are involved at all levels of OTN science activities, including research design, data collection, project management, interpretation of results and use of the information for national purposes.
OTN is also supporting the expansion of partner biotelemetry platforms in North America such as the Integrated Tracking of Aquatic Animals (iTAG; Gulf coast) and the Florida Atlantic Coast Telemetry (FACT; Florida coast) Arrays, and their integration into a shared data system (map in Figure 9). Both iTAG and FACT collaborate with the Atlantic Cooperative Telemetry (ACT; mid-Atlantic) network, a large-scale monitoring effort along the eastern U.S. Together with OTN, these networks form a collaborative and comprehensive cross-border telemetry infrastructure covering North America’s East and Gulf coast from the tropics to the Arctic. Researchers on the east coast and in the Gulf of Mexico are monitoring highly migratory and commercially valued species such as red snapper, bluefin tuna and sharks. An increasing focus of OTN’s international operations is streamlining inter-organizational interactions and information flow, thereby providing timely and comprehensive information to managers. Other North American activities include ongoing successful and productive collaborations with the Prince William Sound Science Center (Alaska), the Great Lakes Acoustic Telemetry Observation System (GLATOS) and the Great Lakes Fisheries Commission (Michigan), as well as with the NOAA’s Animal Telemetry Network within the U.S. Integrated Ocean Observing System (IOOS).
OTN hosts an internationally certified data warehouse – 200 million detection records and growing – that serves as a repository for data collected by OTN researchers. OTN data personnel are actively working to link the OTN data system to those of other organizations, so that investigators registered with the system will be rapidly able to retrieve information about their tagged animals from all participating organizations. OTN is developing a growing suite of telemetry data analysis tools along with a virtual environment pre-loaded with telemetry-specific statistical and spatial analysis tools. In total, six open-source tools now serve a growing database of telemetrists sharing data in the OTN global data warehouse. OTN is also developing interpretation and visualization tools for analysis of tracking data.
In partnership with the Marine Environmental Observation Prediction and Response Network (MEOPAR), OTN operates a fleet of autonomous marine gliders in support of oceanographic and tracking research. For more information on OTN operations, please visit oceantrackingnetwork.org. The OTN is supported by the Canada Foundation for Innovation (CFI), the Natural Sciences and Engineering Council of Canada, and by contributions from international partners.
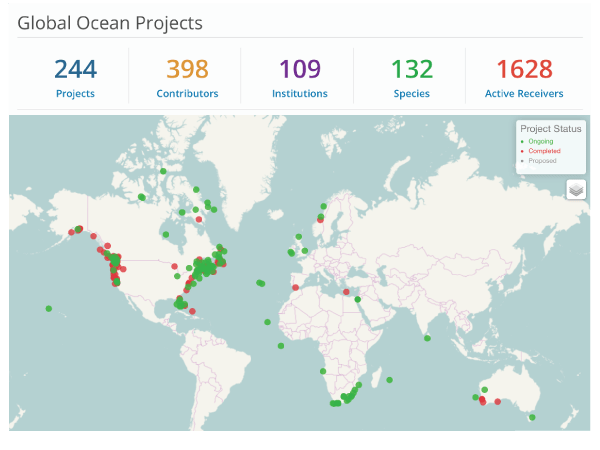 Figure 9. Project Status: Green dots = ongoing projects, grey dots = proposed projects, red dots = completed projects with data archived and available through the OTN data system.
ArcticNet, the integrated Beaufort Observatory (iBO) – Canada
The beginning of ice and ocean monitoring in the Canadian Beaufort Sea can be traced back to the 1980’s when oceanographic moorings were deployed by Fisheries and Oceans Canada (DFO) in partnership with the oil and gas industry to document ice, wave and surge hazards and ocean current variability. During the next two decades, programs that involved government, industry and indigenous peoples injected funding to maintain year-round observations through DFO moorings that focused primarily on the continental shelf and the deep Canada Basin. In the mid-2000’s, ArcticNet established the Long-Term Oceanic Observatories (LTOO) project to maintain moorings in the southeastern Beaufort Sea that were first deployed as part of the Canadian Arctic Shelf Exchange Study (CASES: 2002-2004). These brought a focus on the intervening continental slope which had received little prior attention. The LTOO project has been sustained since then through collaborations with different programs, such as partnerships with the oil and gas industry (2009-2011) and through the Beaufort Regional Environmental Assessment (BREA: 2011-2015).
The integrated Beaufort Observatory (iBO) was conceived in the wake of BREA as a means of fostering synergy among the primary long-term mooring programs in the Beaufort Sea, enabling: 1) continuation of the time series at key locations and 2) synthesis of observations collected over the past three decades. iBO is a four-year program (2015-2018) managed by ArcticNet in partnership with DFO and Golder Associates Ltd. The program is supported by the Environmental Study Research Funds (ESRF) and Imperial Oil Resources Ventures Limited (IORVL). The main iBO platform is an array composed of 7 oceanographic moorings deployed at strategic locations (Figure 10):
- 1 mooring over the slope west of Banks Island to capture hazardous sea ice features propagating along the slope (BR-3);
- A section of 5 moorings crossing the shelf and slope and across exploration leases (DFO-9, DFO-1, DFO-2, BR-G, BR-K); and
- 1 mooring along Mackenzie trough in the western portion of the region (BR-1).
The moored instruments include: acoustic Doppler current profilers (ADCPs) measuring current velocity, current direction, ice drift and plankton scattering; ice-profiling sonars (IPS) allowing continuous measurements of thickness and underside topography of sea ice and storm waves; sensors for salinity and temperature of seawater, turbidity, chlorophyll fluorescence, and dissolved oxygen; and sediment traps. The iBO array is complemented by additional DFO and LTOO moorings, and by the the US Marine Arctic Ecosystem Study (MARES) array (2016-2018) that stretches perpendicular to the Yukon Shelf from 40 to 760 m, hooking up to iBO mooring BR-1. The array targets upwelling events and moorings are equipped with IPS, current meters and ADCPs, and in some cases, nitrate and CO2 sensors.
iBO aims to contribute key oceanographic information and understanding required for decisions on environmental stewardship and on industrial development and its regulation in the Canadian Beaufort Sea. The iBO program address the following needs:
- Information on the magnitude, extent and return period of extreme ice features and of hazardous sea conditions – waves, surge and strong current;
- Ice and ocean datasets to document and interpret inter-annual variability of ice circulation, ocean circulation and particulate matter fluxes in relation to various environmental forcing factors;
- Data to support the development and evaluation of accurate numerical prediction models for operational ocean forecasting and the validation/verification of regional research models for simulating ice, seawater and oil spill trajectories.
The activities conducted under the umbrella of the iBO program in 2017 include the turnaround of the 7 iBO moorings (Figure 11) from the CCGS Sir Wilfrid Laurier. The iBO project team also plans to develop a synthesis report that would merge historical mooring data from DFO and ArcticNet with newly-acquired datasets from iBO and modelling results from collaborators. This initiative would further support the Beaufort Regional Strategic Environmental Assessment by consolidating our understanding of the marine physical environment of the Canadian Beaufort Sea to assist in decision-making related to oil and gas exploration and development on Canada’s frontier lands.
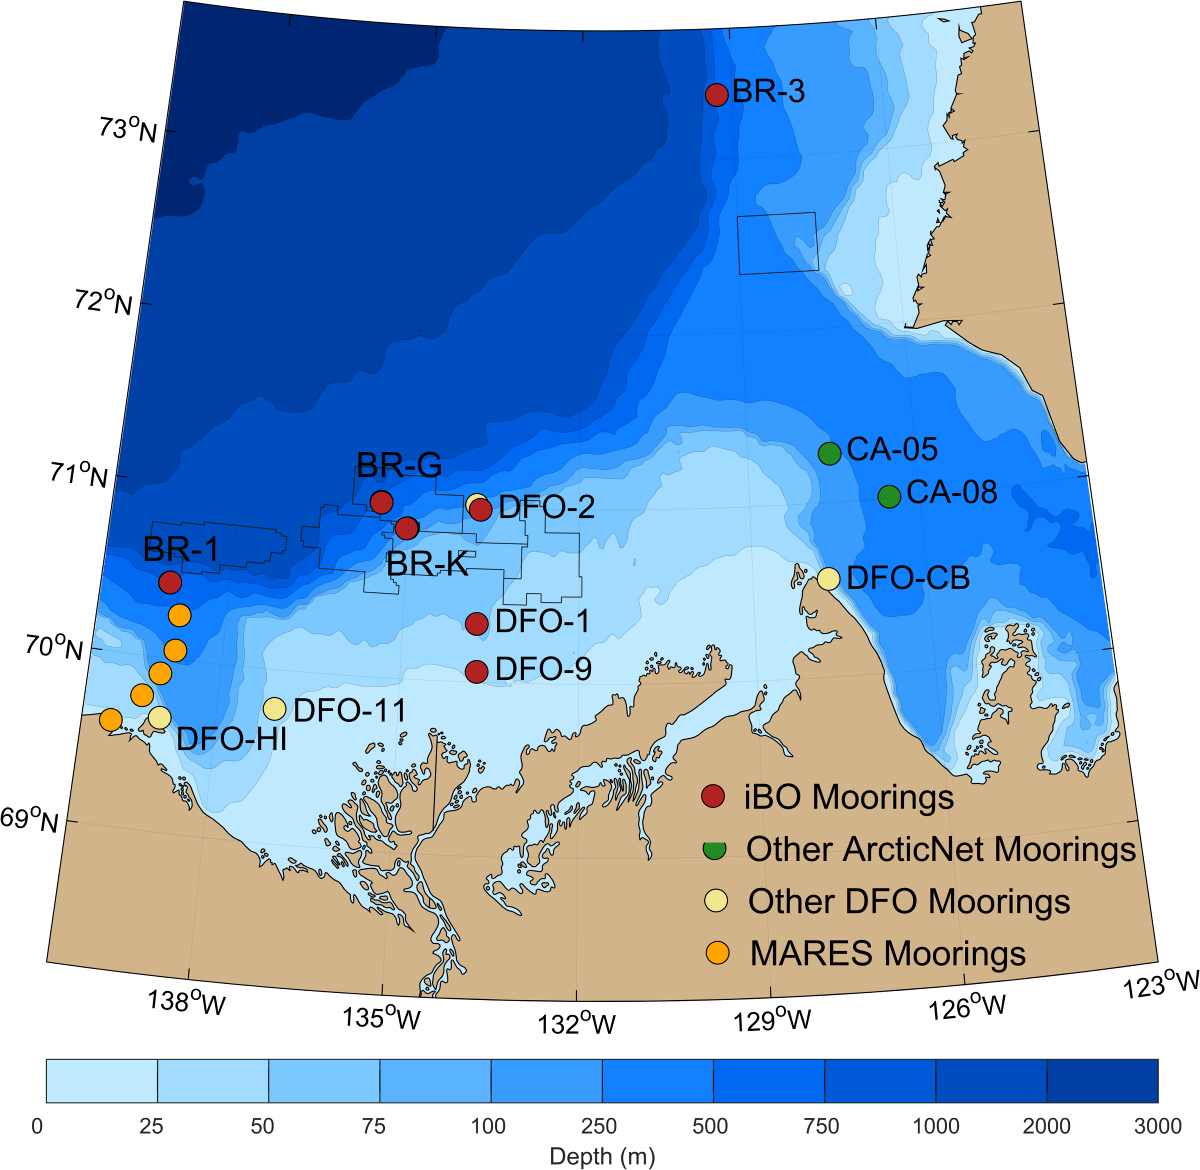 Figure 10. Bathymetric map of the Canadian Beaufort Sea showing the location of iBO moorings (in red). Moorings from other projects (ArcticNet LTOO, DFO, MARES/BOEM program) are also shown on the map.
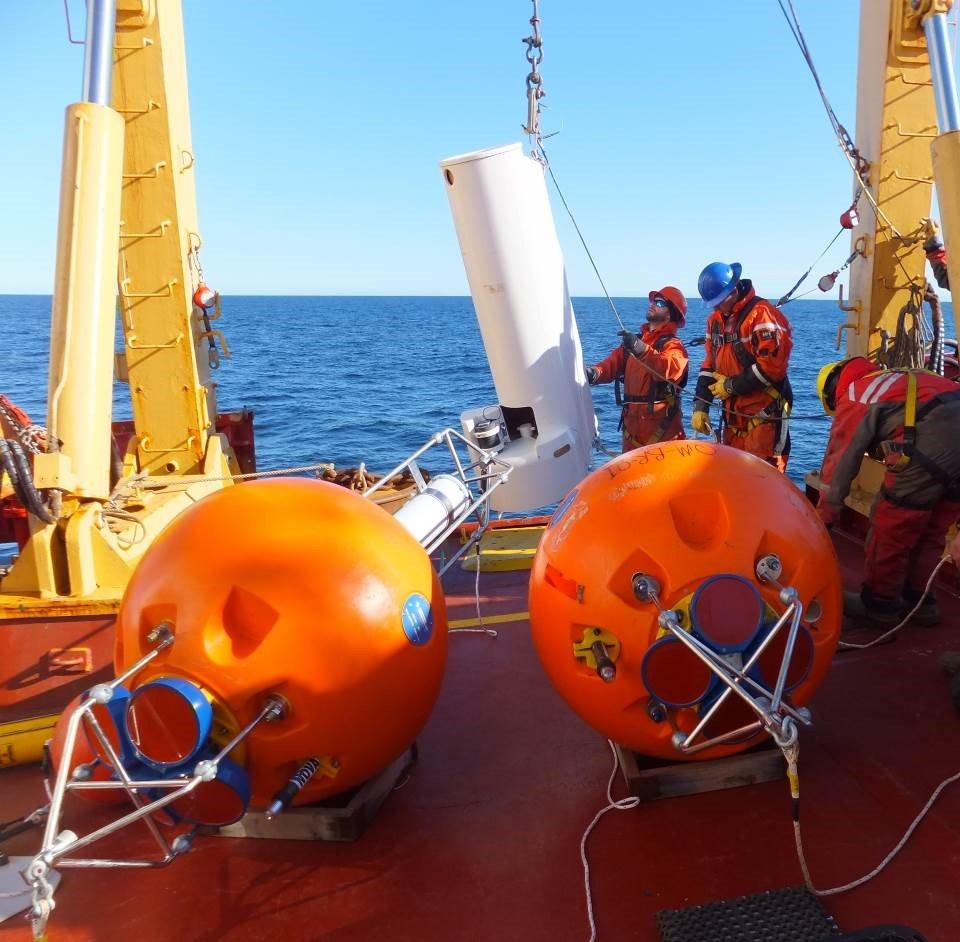 Figure 11. iBO Mooring (Courtesy Alexandre Forest).
Asia
DONET – Japan
DONET is a submarine cabled observatory development program for monitoring earthquakes and tsunamis around Japan. Twelve science nodes and fifty-one observatories were deployed in Nankai Trough by this program. The seismic and pressure (tsunami) data are available on the websites listed below. DONET system can equip additional observatories using the expandable interface on science nodes. Two borehole observatories deployed by the drilling vessel “Chikyu” were connected to DONET using the expandable interface for real-time data acquisition (Figure 12). The borehole observatory C0002 was connected in 2013, which was the world’s first real-time borehole observatory. Subsequently, the second borehole observatory C0010 was connected in 2016 (Figure 13). The borehole observatory is located at 750-940 m below the seafloor at the water depth of 2000 m. The observatory equipped broadband seismometer, pore fluid pressure meter, strain meter, tilt meter, and thermometer arrays to obtain detailed information on crustal deformation. For details visit the NIED Hi-net system website and the JAMSTEC Ocean-bottom Seismology Database.
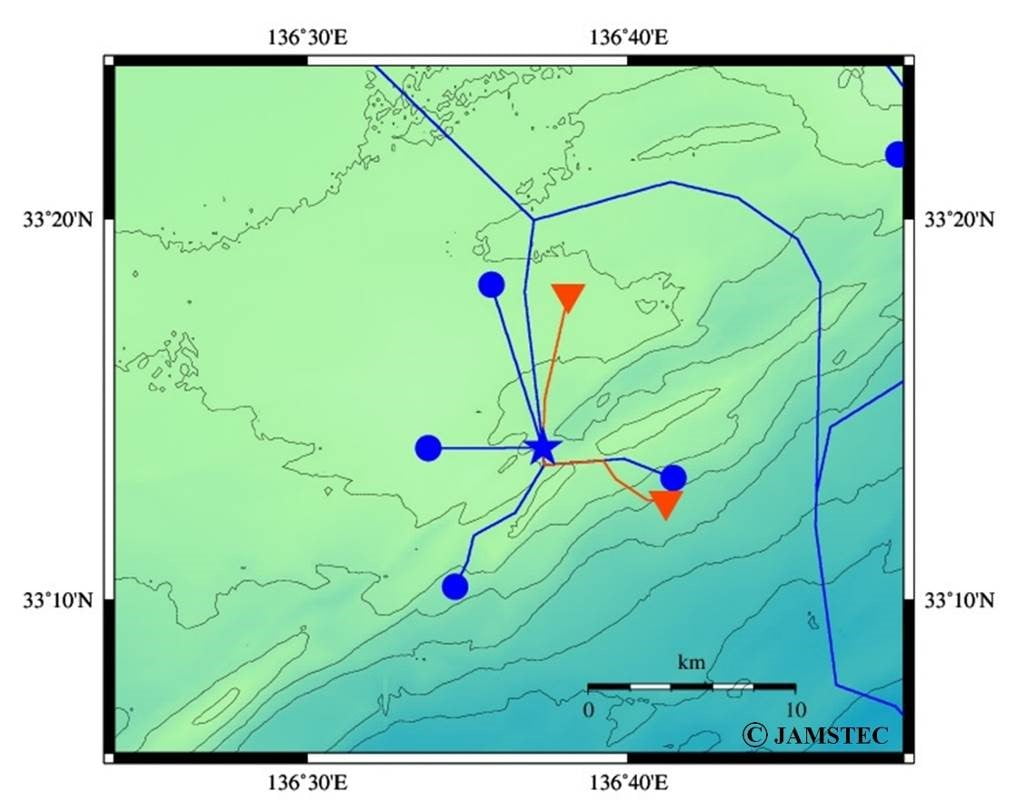 Figure 12. Borehole observatories connected with DONET. Red triangles represent borehole observatories (top: C0002, bottom: C0010).
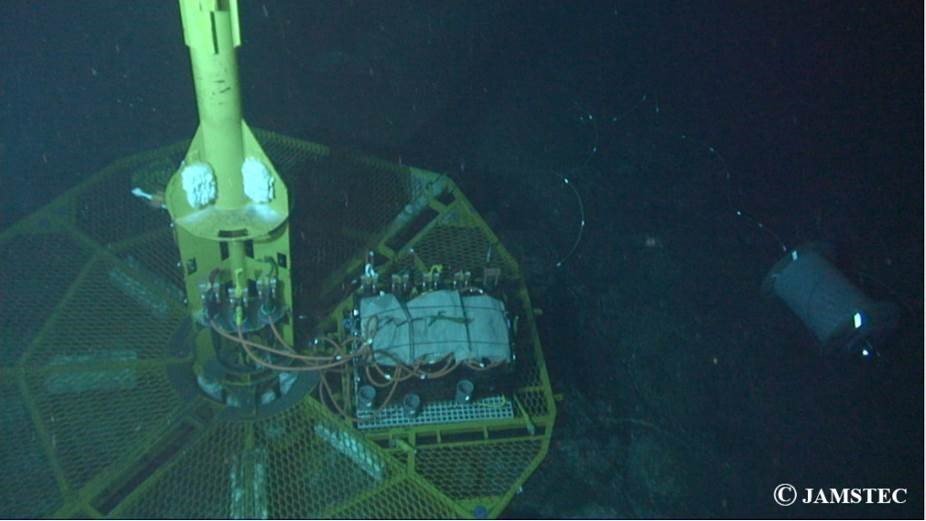 Figure 13. The borehole observatory C0010.
Real-GEMS – Japan
Real-Time Geoscientific Environmental Seafloor Monitoring System (Real-GEMS) is a platform aimed at verifying and evaluating long-term monitoring methods for environmental impact assessment on the site of ocean resource exploration and extraction. Its development was conducted as a research topic of the project called Next-Generation Technology for Ocean Resource Exploration which is one of the projects carried out by Cross-ministerial Strategic Innovation Promotion Program (SIP), Japan. Principal components were developed steadily thus far; however, it has been determined to postpone the development of Real-GEMS from this year due to budget difficulties.
S-net – Japan
Japan’s S-net is the seafloor observation network for earthquake and tsunamis along the Japan Trench operated by National Research Institute for Earth Science and Disaster Resilience (NIED). A construction of S-net was started in 2011 and completed 2017. S-net has 150 real-time monitoring observatories that cover the area about 1000km x 300km from off-Hokkaido to off-Kanto connected in serial by seafloor fiber-optic cables (Figure 14). Each observatory has four sets of three-component seismometers for earthquake observation and two sets of pressure gauge for tsunami monitoring. The principal purposes of S-net are reliable tsunami warning, early Earthquake warning, research of plate subduction including Earthquake generation.
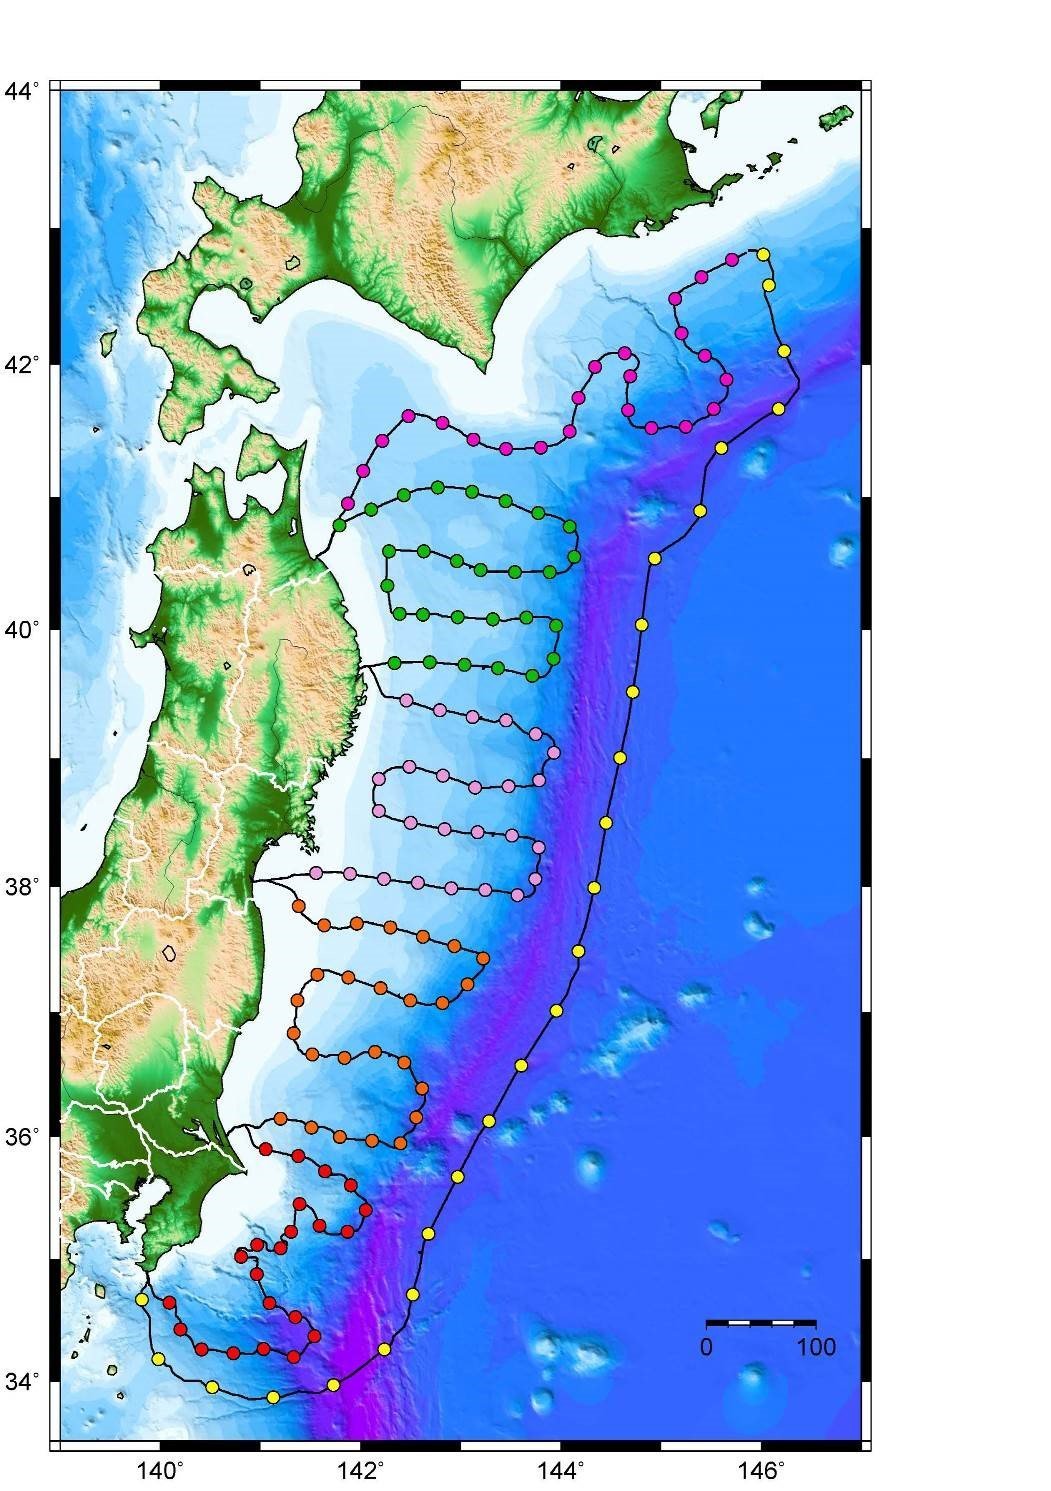 Figure 14. S-net Map.
Indian Ocean Observing Systems – India
Under the Ocean Observation Network program of the Ministry of Earth Sciences, National Institute of Ocean Technology (NIOT) established the moored buoy network in the Indian Seas since 1997. In 2017, the Ocean Observation Systems (OOS) of NIOT celebrated two decades of its existence (Figure 15) achieving many remarkable milestones. The mandate of OOS is to establish the Moored Ocean Observation Network. The current network comprises of Met Ocean (Deep Ocean and Coastal), Tsunami, and CalVal buoy systems.
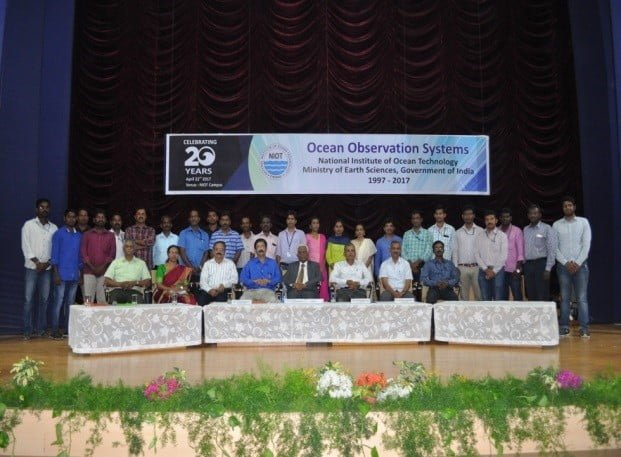 Figure 15. (left) Celebration of the 20-Year anniversary of OOS, NOIT.
Presently 22 buoys are disseminating real time data to India National Center for Ocean Information Services (INCOIS) and to the international community through GTS. Met-Ocean data sets are used for operational forecasts by India Metrological Department (IMD) through National Centre for Medium Range Weather Forecasting (NCMRWF) and by INCOIS for Ocean State Forecast. The indigenous tsunami buoy system is matured and continuous data is made available to INCOIS, and is also being shared with global communities through NOAA-NDBC, USA. Buoy data are used for research, satellite data validation and ocean modeling applications. Globally, India is well recognized for sustenance of this programme. OOS developed the state of art Data Acquisition System (DAS) for moored buoys that has proven to be cost competitive. Seven variants of DAS have been conceived, designed and developed by OOS and are presently in operation. The last two decades of in situ buoy based observations recorded in Northern Indian Ocean have provided valuable information for the following scientific studies:
- Intra-seasonal and diurnal variability studies
- Cyclonic studies
- Arabian Sea warm pool studies
- Satellite validation and inter-comparison studies
- Ocean wave studies
Met-Ocean & OMNI Buoys
The tropical Indian Ocean plays a key role in modulating Indian Summer Monsoon rainfall, weather and climate of India. The Met-Ocean and OMNI buoys have been continuously playing a crucial role in providing data in sparse ocean areas and most notably in times of inclement weather.
IndARC
The first Indian Moored Observatory in the Arctic (IndARC) was successfully deployed in India on 25 July 2014. Data sets are being collected from the Arctic region for three consecutive years with promising results. Presently, IndARC collects data from 11 sensors: conductivity, temperature, dissolved oxygen, pressure, current speed, current direction, nitrate, Photosynthetically Active Radiation(PAR), fluorescence, turbidity and ambient noise all at different depths.
‘iMoon’ Mobile app (Figure 16) was developed for an Android platform to view real-time data of the working buoy systems and metadata of archived data from all moored buoys since 2010. This mobile application software freely available in google play store.
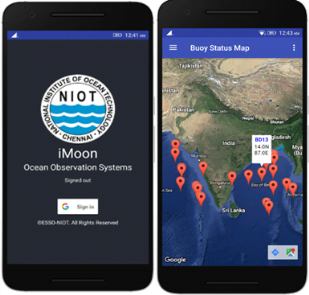 Figure 16. iMoon Mobile App.
Oceania
ALOHA Cabled Observatory – Hawaii
The ALOHA Cabled Observatory (ACO) is a general purpose “node” providing power, communications and timing connectivity for science use at Station ALOHA 100 km north of Oahu (Figure 17). A suite of basic sensors makes core measurements, some local and some sensing the water column. At 4728 m deep, it is the deepest scientific outpost on the planet with power and Internet. ACO has just passed its sixth anniversary, providing power (1200 W), network communications (100 Mb/s) and timing (1 µs) to the seafloor node and instruments.
Station ALOHA is unique in the world for the combination of long-term world-class ocean sampling (the Hawaii Ocean Time-series project, and ACO) coupled with multitudes of short-to-long-term process studies and other research. The basic sensor package installed in September 2015, with pressure, CTDO2, fluorometer and turbidity instruments, continues to provide high quality data. The pressure data is being sent to the Pacific Tsunami Warning Center in real time, and the data in the microseism band is being used to study the signature of a hurricane (Lester, August 2016). The temperature data agree with that from other sensors, all continuing to show episodic sudden 25 mK temperature changes (Figure 18). Further, correlations are seen between temperature, turbidity peaks, and speed, with implications for deep ocean turbulence and long-term monitoring. Fluorometer data show an indication of a summer export pulse of chlorophyll, thus connecting the biology of the overlying ocean to the abyss with ramifications for understanding the carbon cycle. Hydrophone data are providing insights into marine mammal tracking and various seismo-acoustic phenomena including the observation of the seismic So phase that provides information on attenuation in the asthenosphere, and the interaction of water-borne seismic T-phases with bathymetry (through the Kauai-Oahu channel).
A service visit in June 2017 ended at the start, when the winch failed with the UH/SOEST ROV Lu’ukai just 100 m above bottom; in the process of clamping the cable to release tension on the winch, the optical fibers broke. The next service visit will deploy another hydrophone and a secondary node, one light (currently sitting on the seafloor from 2015) will be plugged in, and failed instruments including a camera system, another basic sensor package, and a light will be recovered.
ACO encourages the use of the core data being collecting as well separate experiments that connect to the observatory for power and communications. The ACO is funded by the National Science Foundation and the University of Hawaii at Manoa.
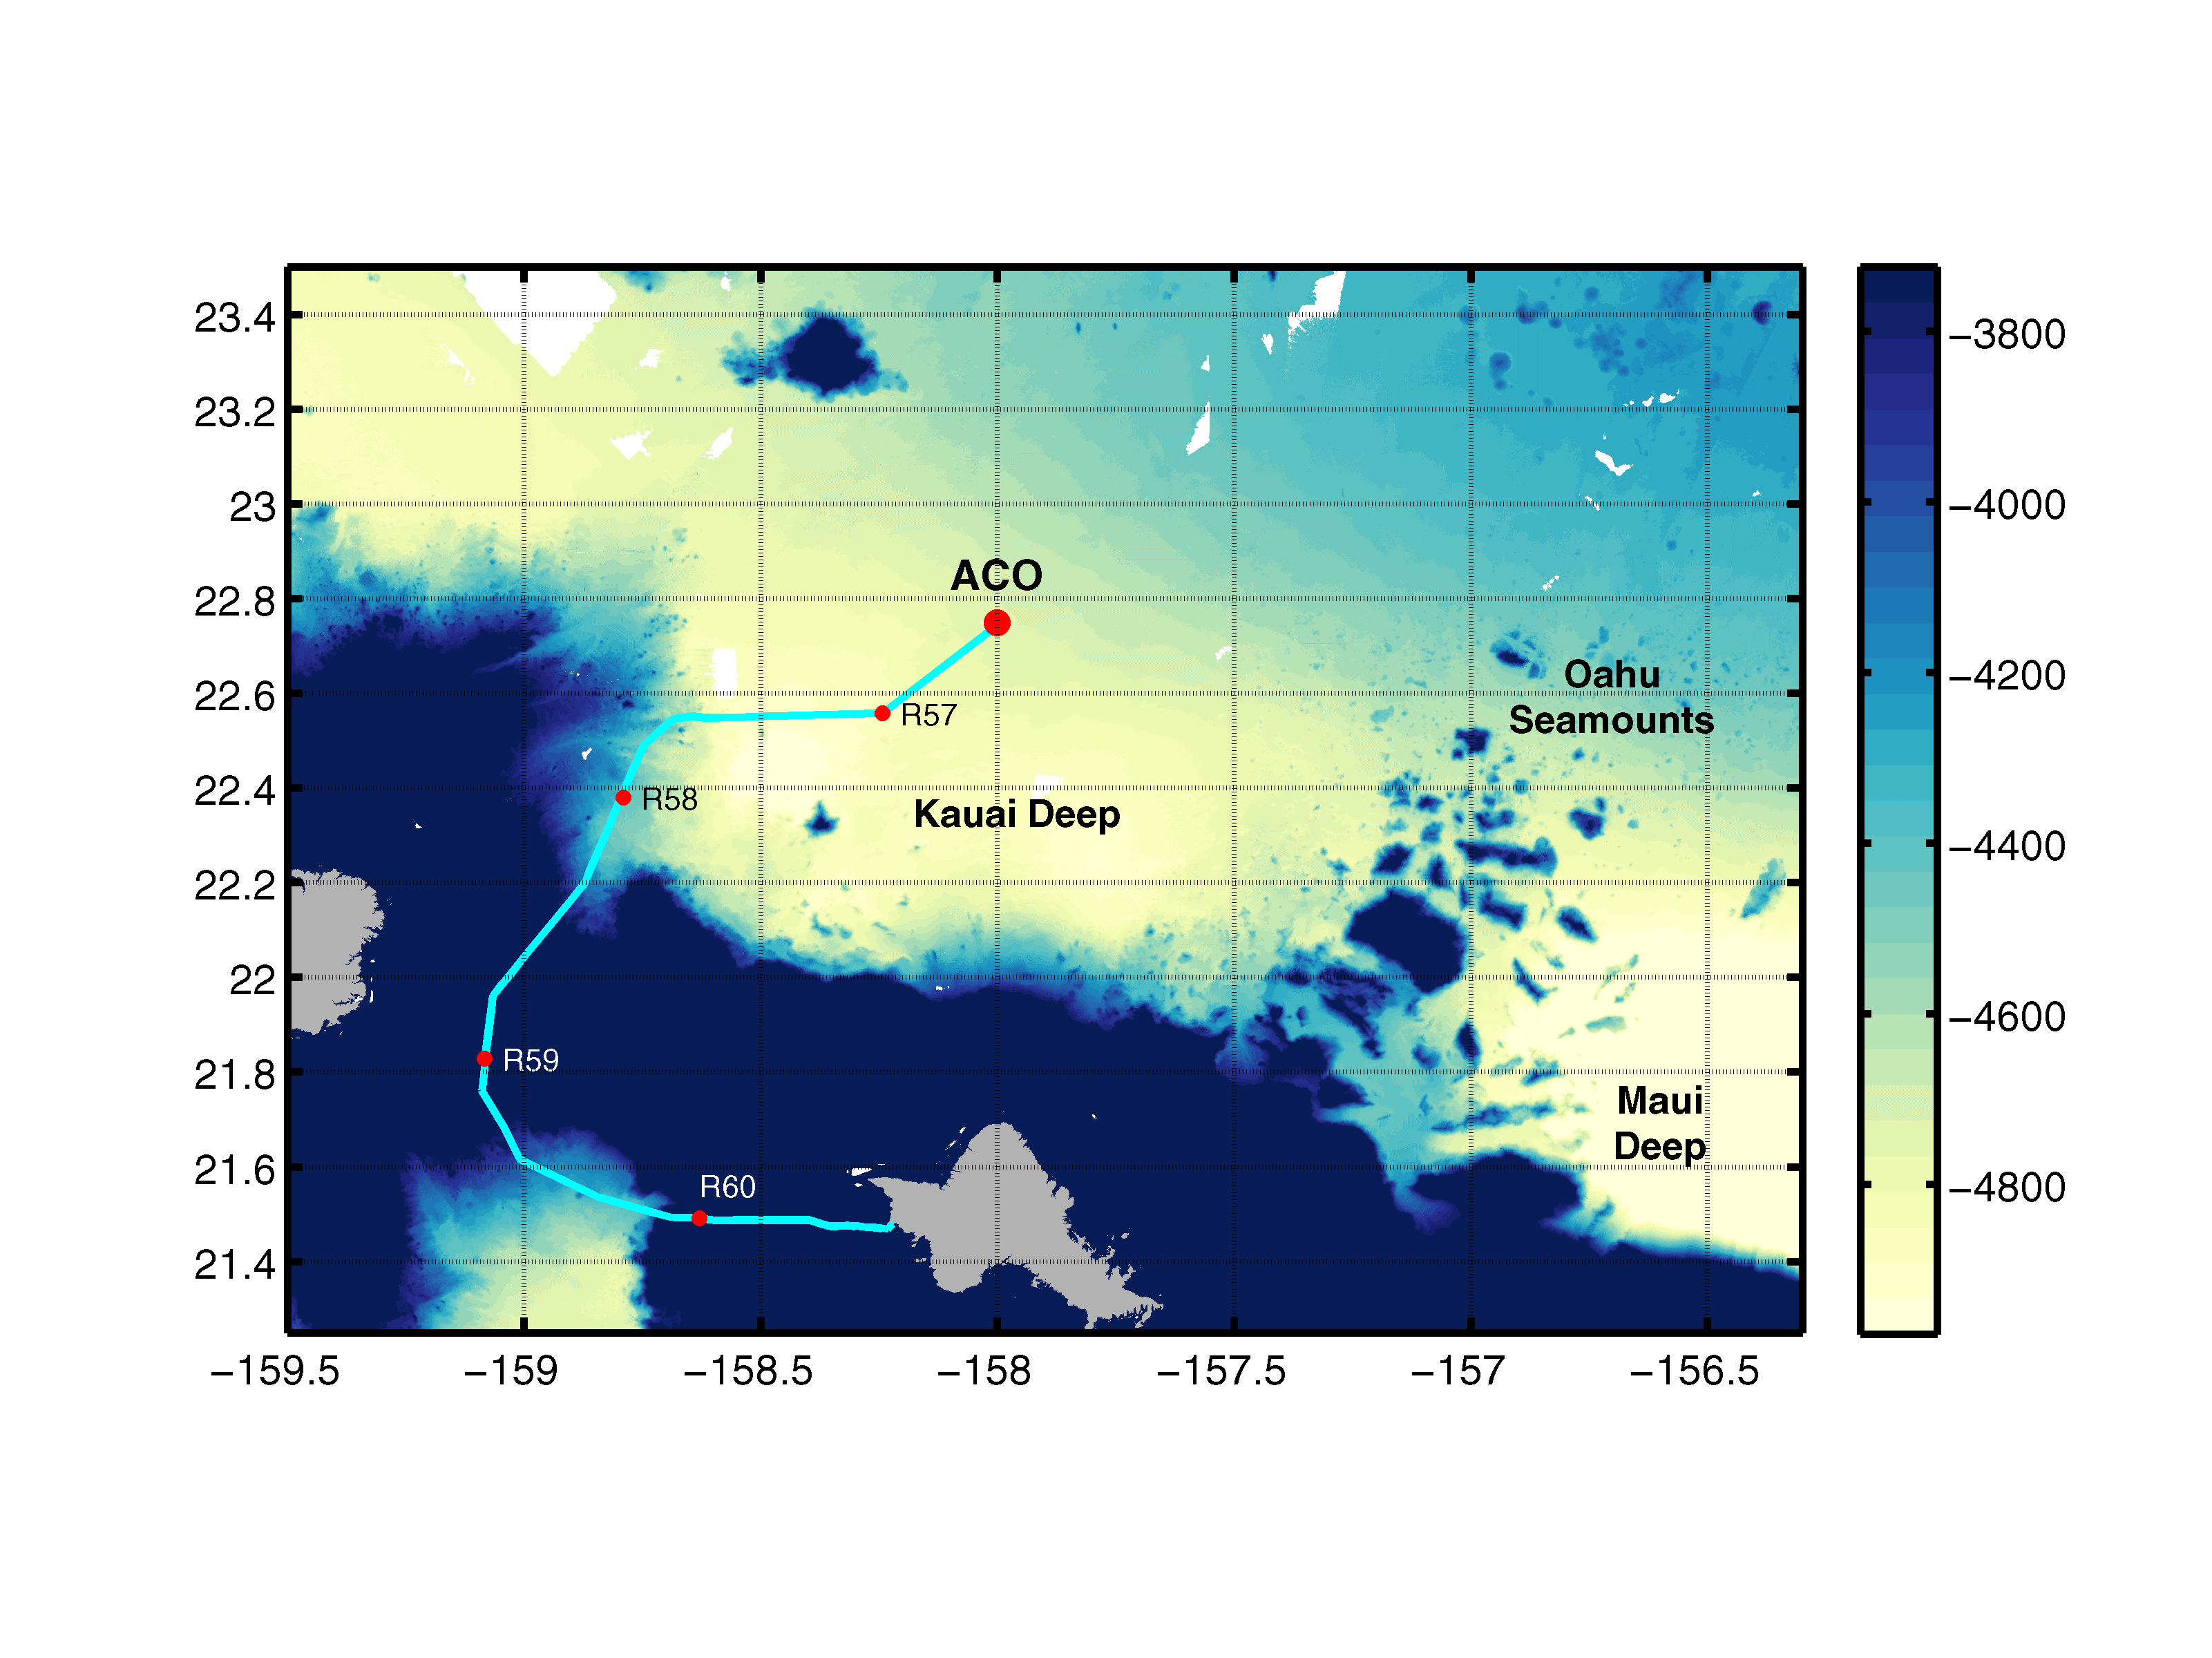 Figure 17. The ALOHA Cabled Observatory (ACO) is at Station ALOHA 100 km north of Oahu in 4728 m water depth. The blue-yellow boundary is at 4000 m.
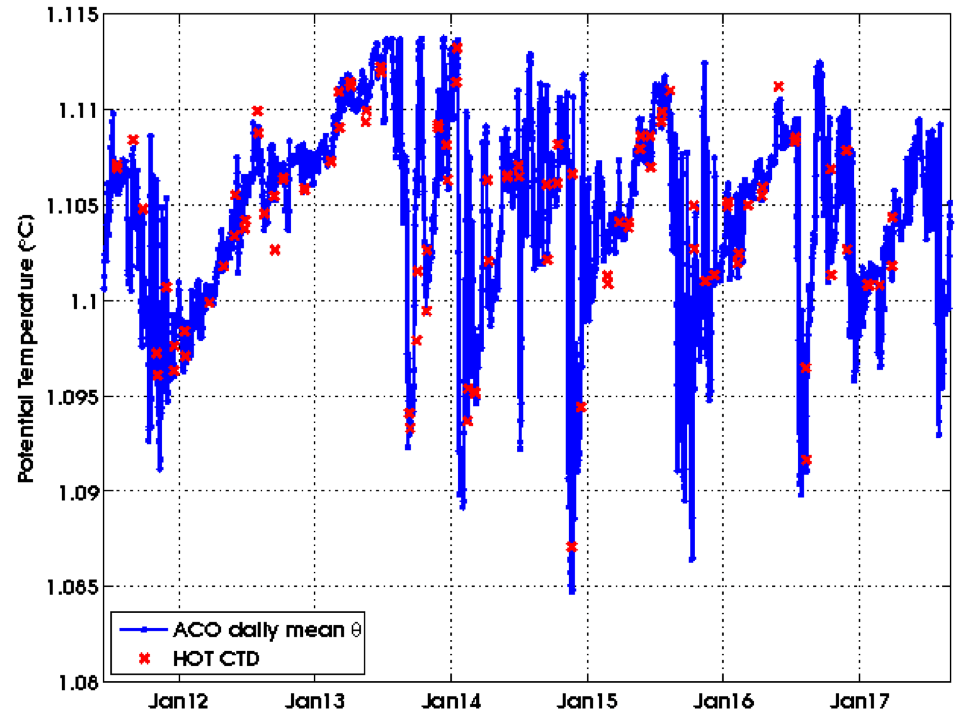 Figure 18. ACO bottom temperature (blue) and HOT CTD temperature (red crosses) since June 2011.
Integrated Marine Observing System (IMOS) – Australia
IMOS celebrated its tenth anniversary with the launch of a ‘decadal impact’ document in November 2016. ‘From Observations to Impact’ provides an introduction to IMOS, a brief history, an explanation of the need for IMOS, and a description of the national capability that has been created. The publication highlights the impact IMOS has created in places around the country and the partnerships it has enabled. The places that IMOS has delivered impact range from the high tropics to Antarctica, east coast and west, from harbours to the deep ocean. The partnerships that create impact come through working with industry, working with universities undertaking research training, through international collaboration to study a globally connected ocean, through working with centres of excellence in marine science and working with the major marine research programs addressing national priorities.
A second decade of IMOS is now well on the way. The Australian Government has made an ongoing commitment to the National Collaborative Research Infrastructure Strategy (NCRIS) through which IMOS is funded. IMOS has been identified as an ongoing priority under NCRIS 2017, and has been provided with two years of funding to 30 June 2019. Long term allocation of funding beyond that date will be determined by the Government response to the 2016 National Research Infrastructure Roadmap, which will happen by the end of the year. Continued public investment in IMOS brings with it a responsibility to deliver significant social, economic and environmental benefits to Australia.
Closer collaboration between our national marine observing and data system, and the various numerical modelling communities, is proving to be increasingly productive. The third biennial Australian Coastal and Oceans Modelling and Observations (ACOMO) Workshop held at the Academy of Science in Canberra was highly successful. ACOMO is clearly filling an important niche in the national marine science system by providing a unique opportunity to bring together observing and modelling, from physics to ecosystems. As well as two outstanding keynote speakers, IMOS was fortunate to have Dr Glenn Nolan, Secretary General of the European Global Ocean Observing System (EuroGOOS) in attendance. IMOS and EuroGOOS are two of thirteen regional alliances of the global ocean observing system, and IMOS benefits tremendously by benchmarking against their most advanced peers.
The IMOS Ocean Glider Facility together with Rutgers University (USA) have deployed an ocean glider ‘Challenger’ in a mission which aims to cover a distance of 6,200 km from Fremantle Western Australia to Galle Sri Lanka. If successful, the mission will set a new world record for distance covered by an ocean glider in a single journey. The glider departed Australia on 5 November 2016 and it reached the Equator in June. The data will be able to assist in predicating ocean trends in the future. This will be helpful for mariners and shipping routes, but most importantly it is to look at how the ocean climate is changing. The mission will collect data across the ocean basins and see how the temperature and salinity changes with depth. It can then be compared to previous measurements taken 40 years ago.
The broader benefits of sustained ocean observing and open data access were highlighted in the 2016 State of Environment Report released in March 2017. It is the fifth national assessment of the state of Australia’s environment, reporting on the current condition of and likely outlook for the environment. The report included a chapter on the Marine Environment with many references to IMOS. These cover research using IMOS observations as well as targeted analysis of datasets and time series that simply did not exist before IMOS, and were not available for previous State of Environment reports. IMOS has been used to help understand pressures on the marine environment, such as climate variability and change, and to help assess state and trends of marine biodiversity and ecosystem health.
The Antarctic and surrounding Southern Ocean are one of the most important, yet least observed of marine habitats. Connecting all the world’s oceans, the physical structure of the Southern Ocean profoundly influences world climate and ecology, and plays a key role in global climate. IMOS has been tagging elephant seals since 2011 to collect important data on ocean properties throughout the Antarctic winter – data previously unavailable but crucially important to oceanographic and climate studies. The seal tagging component of IMOS is made possible with logistical support and funding from the Australian Government’s Australian Antarctic Program. A study using IMOS data from elephant seals, discovered that fresh water from Antarctica’s melting ice shelves slows the production of powerful deep-water ocean currents responsible for regulating global temperatures.
During the austral summer of 2015/16, sea surface temperatures (SSTs) off southeast Australia were up to 3 – 4°C above climatological averages, the warmest on record for that region. A recent study reported on this intense marine heatwave event using data from the IMOS National Reference Station at Maria Island (Figure 19) and ocean surface circulation data from IMOS OceanCurrent. The event impacted regional biodiversity, such as the appearance of marine species normally found further north, and was a detrimental stressor on coastal fishery and aquaculture industries, including the abalone, Pacific oyster and Atlantic salmon industries. The ocean off southeastern Australia is a global warming hotspot. The near-surface waters there are warming at nearly four times the global average rate and these increasing temperatures are seen as deep as 750 m. This warming has been linked to enhanced southward transport in the East Australian Current, driven by increased wind stress curl across the mid-latitude South Pacific. Future projections under anthropogenic climate change indicate continued strengthening of the southward transport in the East Australian Current Extension, linked with increased wind stress curl over the South Pacific, and a corresponding increase in the likelihood of extreme temperature events.
In September 2016, the Australian Ocean Data Network (AODN) was adopted by the National Marine Science Committee (NMSC) as the main conduit for publishing Australian marine data. The AODN Portal provides access to all available Australian marine and climate science data and provides the primary access to IMOS data including access to the IMOS metadata. The AODN portal currently includes data collections served by 11 organizations (with many more contributing) and 170 data collections can be discovered, accessed, sub-setted and downloaded.
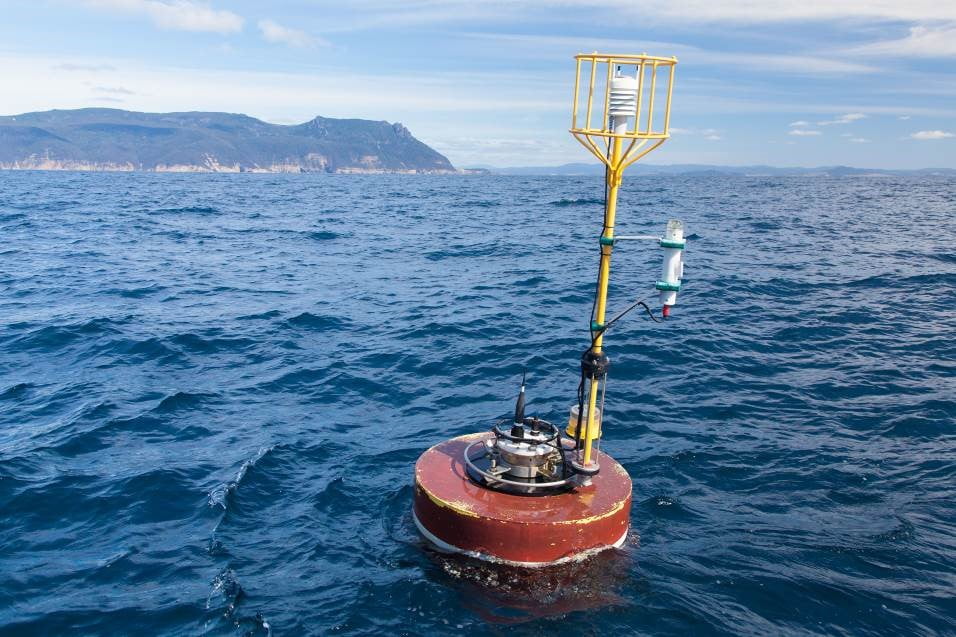 Figure 19. IMOS National Reference Station off Maria Island, Tasmania (Courtesy Carlie Devine).
For more information about this update article or to contribute to next year’s article please contact: [email protected].